Açıklama
FOOTPRINT PRO — TEKLİF x TALEP KÜME GRAFİĞİ
Mumlar fiyatın nerede hareket ettiğini söyler. Bir footprint size kimin hareket ettirdiğini söyler. Footprint Pro, her mumu gerçek tick verilerinden oluşturulan fiyat kümelerine ayırır ve alıcılar ile satıcıların tam olarak nerede mücadele ettiğini — ve kimin kazandığını gösterir.
Bu tür bir emir akışı analizi genellikle özel bir platform ve aylık abonelik gerektirir. Footprint Pro, bunu cTrader'a yerel olarak getirir, tek seferlik bir satın alma olarak.
🆕 SÜRÜM 2'DE YENİ
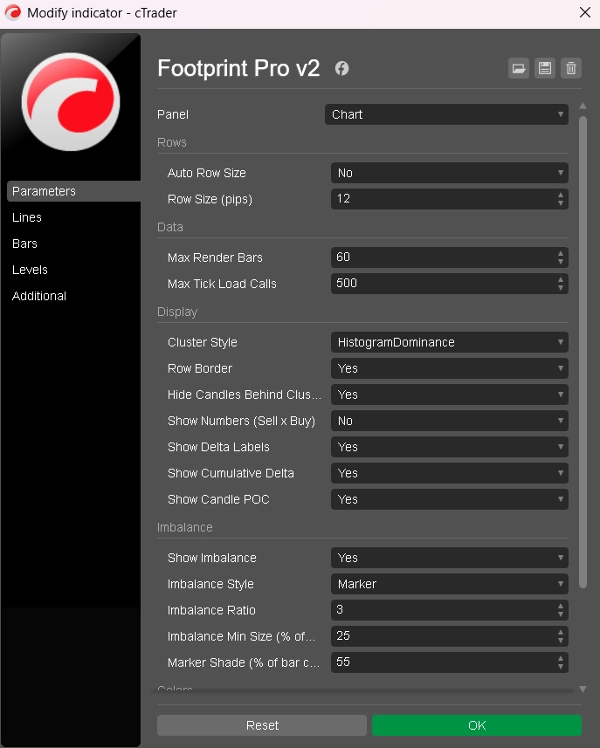
• Histogram kümeleri — her satır artık hacmini taşıyan uzunlukta bir çubuk olarak çizilir, böylece en yoğun satırlar renk tonlarını çözmeden öne çıkar. Tek bir baskın renk, alım/satım ayrımı veya orijinal ısı haritasını seçin.
• Seçtiğiniz renkte satır sınırları. Bunları grafik arka planınıza ayarlayın ve satırlar net, eşit aralıklı çubuklara ayrılır.
• Daha temiz dengesizlik — işaretçiler artık satırı çerçevelemek yerine satırın yanındaki kenar boşluğunda yer alır, açma/kapama anahtarı, sadece ağırlık taşıyan satırların işaretlenmesi için minimum boyut filtresi ve yanındaki çubuğa asla karışmayan bir ton ile.
• Üniform küme genişliği — bir oturum boşluğu daha önce bir kümeyi komşularıyla üst üste binecek kadar genişletebilirdi. Artık her mum aynı genişliğe sahip.
• Daha temiz ilk görünüm için yeni varsayılanlar: sabit 10 pip satırlar, baskın stil, sayılar kapalı. Mevcut ayarlarınız dokunulmamış.
🔍 HER MUMDA GÖRDÜKLERİNİZ
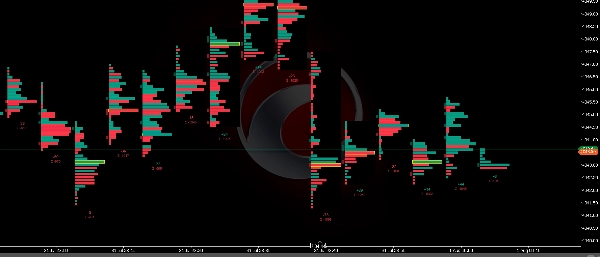
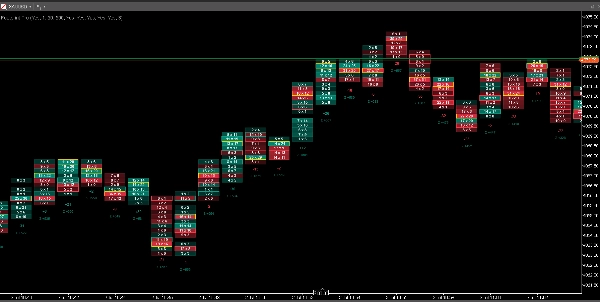
• Hacim kümeleri — her mum fiyat satırlarına bölünür ve her satır işlem hacmini taşıyan uzunlukta bir çubuk olarak çizilir. En yoğun satır bir bakışta bellidir, renk çözümlemesi gerekmez.
• Üç küme stili — baskın (her satır için tek renk, en temiz okuma), alım/satım ayrımı (her çubuk satış ve alış hacmine bölünmüş), veya ısı haritası (tam genişlik, aktiviteye göre yoğunluk).
• Satış x Alış sayıları — yakınlaştırın ve her satır gerçek uptick/downtick hareketine göre sınıflandırılmış tam satış ve alış tick sayılarını gösterebilir.
• Mum POC — her mumun en yoğun fiyat satırı, altın renk ile çevrelenmiş.
• Delta — her mum için net alış ve satış, her çubuğun altında yazılı.
• Kümülatif delta — her mumun altında günlük sıfırlanan oturum delta (Σ). Farklılıkları tespit edin: fiyat yüksek yaparken Σ düşüyorsa, bu hiçbir mum grafiğinin veremeyeceği bir uyarıdır.
• Dengesizlik işaretçileri — saldırganlığın karşı tarafı çapraz olarak ezdiği yerde, satırın yanındaki kenar boşluğunda bir işaretçi belirir. İşaretçiler çubukların dışında kendi sütunlarında yer alır, böylece küme temiz kalır ve üst üste işaretçiler kolayca fark edilir — genellikle kurumsal aktiviteyi işaret ederler.
⚡ GERÇEK TICK VERİLERİNDEN OLUŞTURULMUŞTUR
• Her küme brokerınızın gerçek tick geçmişinden oluşturulur — bar yaklaşık değerleri değil.
• Akıllı tembel yükleme: sadece görünen mumlar arka planda işlenir, böylece grafiğiniz asla donmaz.
• Canlı güncellemeler: mevcut mumun kümeleri, delta ve Σ ticaret gerçekleşirken tick bazında güncellenir.
• Derin geçmiş: brokerınızın tick verisinin ötesine kaydırdığınızda, Footprint Pro otomatik olarak M1 tabanlı yaklaşık değere geçer ve bu barları ≈ ile işaretler — boş grafik yok, sürpriz yok.
🎯 TİCARETÇİLER NASIL KULLANIYOR
• Kopmaları onaylayın: güçlü delta ve kopma mumundaki üst üste binmiş dengesizlikler gerçek hareketleri tuzaklardan ayırır.
• Tükenmeyi azaltın: yüksek hacim ve azalan delta, bir dönüş yüksek/düşüğünde absorpsiyonu işaret eder.
• Farklılığı okuyun: fiyat yükselirken + kümülatif delta düşerse = gerçek alış olmadan rallidir.
• Girişleri iyileştirin: keyfi fiyatlar yerine mum POC veya dengesizlik seviyelerinden giriş yapın.
⚙️ TAMAMIYLA AYARLANABİLİR
• Pip cinsinden sabit satır boyutu veya sembolün aralığına uyum sağlayan otomatik boyutlandırma.
• Kendi renginizle satır sınırları — bunları grafik arka planınıza ayarlayın ve satırlar net, eşit aralıklı çubuklara ayrılır.
• Dengesizlik kontrolleri: açma/kapama, işaretçi veya çerçeve, oran ve sadece gerçekten ağırlık taşıyan satırların işaretlenmesi için minimum boyut filtresi.
• Sayıları, delta etiketlerini, kümülatif deltayı ve mum POC'u bağımsız olarak açıp kapatın.
• Her renk özelleştirilebilir, ayrıca render limiti ve yazı tipi boyutu.
• Mumlar, temiz ve profesyonel bir footprint görünümü için kümelerin arkasında otomatik olarak gizlenir.
🧪 SATIN ALMADAN ÖNCE DENEYİN
Ücretsiz deneme sürümü mevcut — aynı motor, en son 15 mumu gösterir. Önce brokerınızın verisinde test edin, sonra tam sürüme yükseltin.
Her sembolde çalışır. En iyi deneyim M1–M15 grafiklerde. Tek seferlik satın alma, abonelik yok, ücretsiz güncellemeler.
Özet
The indicator updates live with tick-by-tick data and uses smart lazy loading to maintain chart performance. When tick data is unavailable, it switches to an approximate mode based on 1-minute bars, clearly marking these bars. Footprint Pro supports full customization of row sizing, display options (numbers, delta labels, POC, imbalances), color schemes, and imbalance sensitivity.
Traders use Footprint Pro to confirm breakouts, detect exhaustion and absorption, identify divergences between price and volume, and refine entry points based on volume clusters rather than arbitrary prices. It works on any symbol, is optimized for 1- to 15-minute charts, and is available as a one-time purchase with free updates. A free trial version displays the most recent 15 candles for evaluation.