
Price Change Bundle 1.0 BT
Индикатор
2 покупки
Версия 1.0, Aug 2025
Windows, Mac
4.0
Отзывы: 1
Описание
Price Change Bundle — 3 индикатора, 1 логика.
Инструменты из моей собственной настройки (Supply & Demand + кастомный ZigZag). Созданы, чтобы показать, как цена действительно движется вокруг закрытий на старших таймфреймах.
Включайте или выключайте любой модуль — активируйте/деактивируйте Уровни, Бары, Гистограмму по отдельности.
Модули
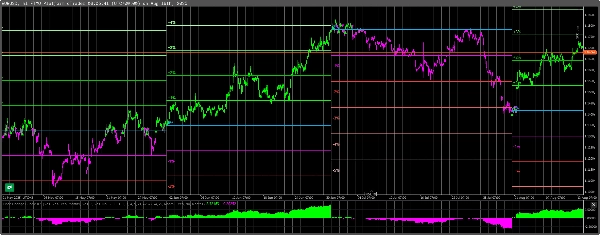
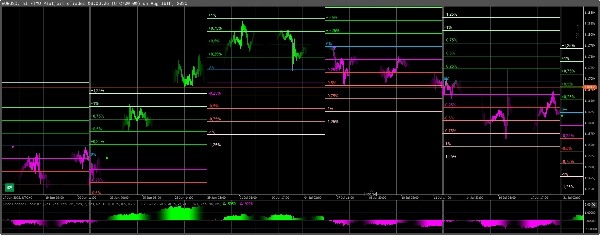
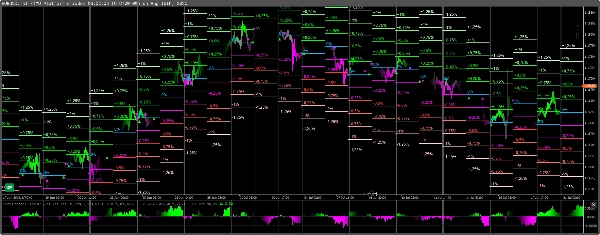
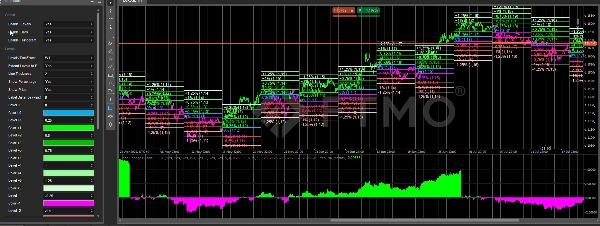
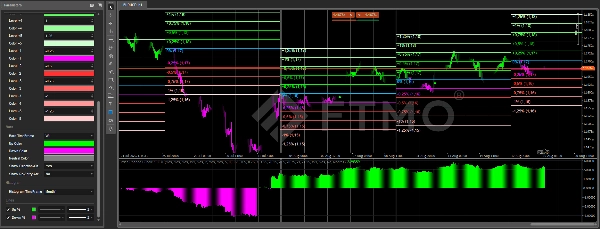
Price Change Levels
- Рисует процентные зоны (±0.25…±1.25%) на выбранном таймфрейме.
- Каждая зона измеряется от базовой линии 0% и отображает % и цену.
- Возможность продлить линии до конца периода для чистых недельных/месячных карт.
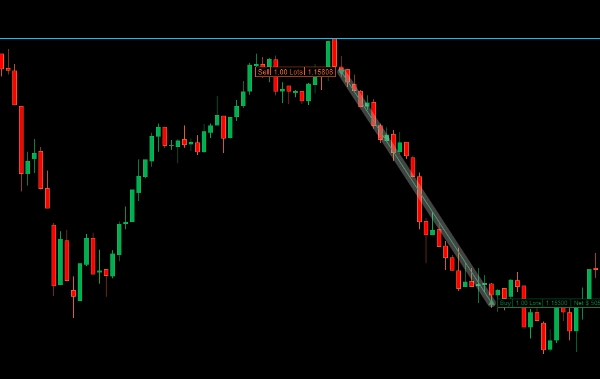
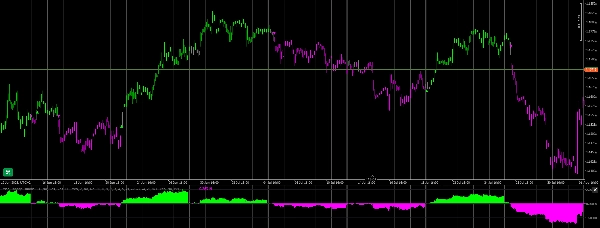
Price Change Bars
- Окрашивает свечи по режиму Полностью выше/ниже относительно пивота таймфрейма.
- Лучше всего использовать на закрытии бара для входов и быстрого понимания режима.
- Включает стрелки Смена направления и Повторный вход (после нейтрального → на ту же сторону).
Price Change Histogram
- Показывает общий процентный прирост относительно того же эталонного таймфрейма (Up% / Down%).
- Отлично подходит для быстрого выявления ускорений/замедлений.
Почему это работает — «Секреты движения цены»
- Профессионалы ориентируются на предыдущие закрытия старших таймфреймов (MN/W1/D1).
- Измеряемые процентные расстояния от этой точки служат практическими магнитами/целями.
- Свеча полностью выше/ниже пивота определяет режим; повторный вход после нейтрального часто продолжает движение.
Гибкое использование
- Выбирайте любой таймфрейм для каждого модуля (например, MN Levels • W1 Bars • D1 Histogram).
- Работает с любым типом графика, включая Renko/range/tick (расчёты используют выбранные вами временные таймфреймы).
- Без перерисовки. Лёгкий.
Видео и поддержка
- Пошаговое видео (установка, пресеты, примеры сделок) будет опубликовано скоро.
- Покупатели могут связаться со мной напрямую по любым вопросам, помощи с настройкой или отзывам. Я отвечаю лично.
Сводка
ИИ-сводка
Price Change Bundle 1.0 BT is a composite indicator consisting of three modules—Levels, Bars, and Histogram—designed to analyze price movements relative to higher timeframe closes. It integrates concepts from Supply & Demand and a custom ZigZag to reveal how price behaves around significant reference points.
- Price Change Levels: Displays percentage zones (±0.25% to ±1.25%) from a 0% baseline within a selected timeframe, showing both percentage and price values. Lines can be extended to the period’s end for clear weekly or monthly mapping.
- Price Change Bars: Colors candles based on their position relative to the timeframe pivot, indicating regimes with full above/below coloring. Includes arrows signaling direction changes and re-entries after neutral phases, aiding entry decisions.
- Price Change Histogram: Illustrates overall percentage development (Up%/Down%) against the same timeframe reference, facilitating quick identification of acceleration or slowdowns.
Each module can be toggled on or off independently and configured with different timeframes. The indicator works on any chart type, including Renko, range, and tick charts, using time-based timeframe calculations. It anchors calculations to previous closes of higher timeframes (monthly, weekly, daily) and does not repaint. Buyers have access to direct support from the developer.
Профиль индикатора
Отзывы покупателей
4.0
Отзывы: 1
5 | 0 % | |
4 | 100 % | |
3 | 0 % | |
2 | 0 % | |
1 | 0 % |
Отзывы покупателей
February 9, 2026
Price Change Bundle 1.0 BT delivers clear and practical price-change metrics. Best used on M10-H1, where momentum readings stay balanced and meaningful. Great for filtering weak moves, confirming impulse strength and improving intraday timing. A simple but effective companion for momentum-based strategies.
Обсуждение
Частые вопросы
Prop
Forex
Signal
Breakout
Indices
Продукты, доступные в cTrader Store, включая торговых ботов, индикаторы и плагины, предоставляются сторонними разработчиками и доступны исключительно в информационных и технических целях. cTrader Store не является брокером и не предоставляет инвестиционные консультации, персональные рекомендации или какие-либо гарантии будущей доходности.


Цена
48
Продажи
1.05K
Бесплатные установки