Mô tả
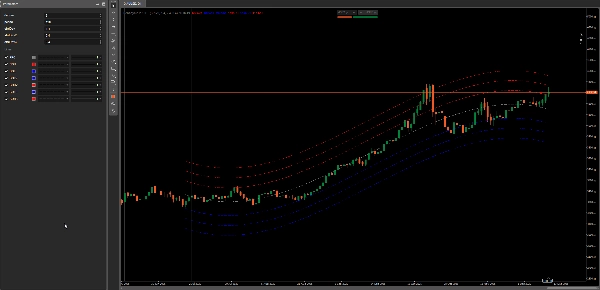
Belkhayate PRC (Kênh Hồi Quy Đa Thức)
1 đường cong. 3 dải độ lệch. Cấu trúc rõ ràng.
Belkhayate PRC là một Kênh Hồi Quy Đa Thức với 3 phong bì độ lệch chuẩn.
Nó giúp bạn phát hiện vùng trung bình, sự mở rộng và sự kiệt sức một cách đơn giản: giá có xu hướng dao động quanh một đường cong hồi quy mượt mà — và các dải ngoài thường hoạt động như các vùng phản ứng thực tiễn.
Phiên bản này là miễn phí, vì tôi muốn mọi nhà giao dịch đều có thể thử nghiệm, hiểu và quyết định xem nó có phù hợp với quy trình làm việc của họ hay không.
Nó làm gì
Đường cong Hồi Quy Đa Thức (PRC)
- Phù hợp với một đường cong hồi quy mượt mà cho N thanh cuối cùng (Chu kỳ của bạn).
- Bậc 1–4: từ làm mượt nhẹ đến độ cong mạnh hơn.
Các Dải Độ Lệch (3 cấp độ)
- 3 phong bì dựa trên lỗi hồi quy (độ lệch chuẩn).
- Hữu ích như “vùng” cho các đợt hồi, cực đoan và điều kiện hồi quy về trung bình.
Tại sao nó hữu ích
- Độ rõ xu hướng mà không cần chồng MA trễ
PRC cung cấp cho bạn một “trọng tâm” rõ ràng cho Chu kỳ cuối cùng. - Các cực đoan có cấu trúc
Các dải giúp bạn đánh giá khi giá bị kéo căng so với khi nó trở lại vùng bình thường. - Tuyệt vời cho bối cảnh + thực thi
Sử dụng TF cao hơn để xác định hướng/bối cảnh và TF thấp hơn để vào lệnh tại các vùng đường cong hoặc dải.
Lịch sử / nguồn gốc ý tưởng
Công cụ này được lấy cảm hứng từ khái niệm cổ điển về kênh hồi quy được sử dụng trong phân tích kỹ thuật (phù hợp một đường hồi quy/đường cong với giá và xây dựng các phong bì dựa trên độ lệch).
Tên “Belkhayate” thường được liên kết với phiên bản phổ biến của kênh kiểu PRC này được chia sẻ trong các cộng đồng giao dịch.
Phiên bản cTrader của tôi là một tái tạo sạch sẽ, tập trung vào sự ổn định, cài đặt và tính khả dụng thực tế trên các biểu đồ hiện đại.
Cách sử dụng được khuyến nghị
- Thị trường có xu hướng: giao dịch các đợt hồi về phía PRC, quản lý rủi ro bằng cách sử dụng dải gần nhất
- Thị trường trong biên độ: giao dịch ngược lại các cực đoan (dải 2 / dải 3) trở về phía PRC
- Kiểm tra biến động: các dải mở rộng = biến động mở rộng / tăng tốc
Tóm tắt
This indicator helps traders identify mean zones, expansion phases, and exhaustion points by showing how price oscillates around the regression curve, with outer bands often acting as reaction areas. It is applicable across various markets including Forex, indices, commodities, stocks, and cryptocurrencies, supporting symbols like BTCUSD, EURUSD, GBPUSD, XAUUSD, NAS100, and USDJPY.
Recommended uses include trading pullbacks toward the PRC in trending markets, fading extremes in ranging markets, and monitoring volatility through band width changes. The tool is designed for clarity and practical usability on modern charts, suitable for combining higher timeframes for context with lower timeframes for execution.
Đánh giá của khách hàng
5 | 100 % | |
4 | 0 % | |
3 | 0 % | |
2 | 0 % | |
1 | 0 % |