
Deskripsi
Camarilla oleh Bullitt Traders — Visualisasikan Struktur. Perdagangan Presisi.
Indikator pivot Camarilla kelas profesional untuk cTrader, dibuat untuk mengungkap bagaimana harga bereaksi di sekitar level institusional.
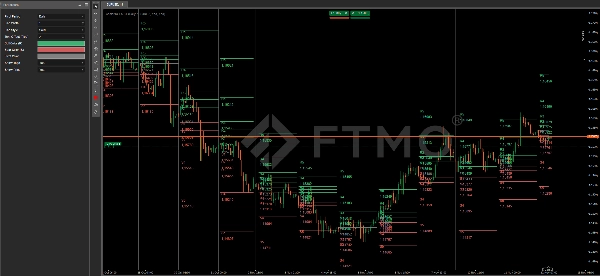
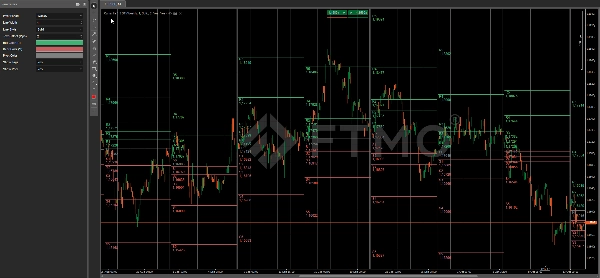
Ini secara otomatis memplot semua level kunci Camarilla (R1–R5 / S1–S5) dan titik pivot di berbagai kerangka waktu — memberikan peta struktural yang jelas bagi trader untuk pembalikan dan breakout.
Fitur Utama
- ✅ Formula Camarilla Asli — menghitung level dari harga tertinggi, terendah, dan penutupan periode sebelumnya.
- 📊 Logika Multi-TF — pilih antara periode pivot Harian, Mingguan, atau Bulanan.
- 🕒 Pemetaan Historis — secara otomatis menggambar periode masa lalu untuk konteks visual dan analisis struktur.
- 🎨 Gaya Kustom — sesuaikan lebar garis, gaya, dan warna per rezim (bullish, bearish, netral).
- 💬 Label & Harga — aktifkan atau nonaktifkan tampilan teks dan nilai untuk tata letak yang bersih atau rinci.
- ⚡ Ringan & Tidak Melukis Ulang — dioptimalkan untuk kecepatan dan akurasi pada simbol apa pun.
- 🧩 Bekerja pada Semua Jenis Grafik — kompatibel dengan waktu, rentang, tick, dan Renko.
Level Camarilla
R5 – Zona target breakout ekstrem
R4 – Resistensi utama, potensi pemicu breakout
R3 – Zona pembalikan atas, sering digunakan untuk entri short
R2 – Resistensi tingkat menengah
R1 – Resistensi awal, level reaksi awal
PP – Titik pivot pusat (zona mean-reversion)
S1 – Dukungan awal, level reaksi awal
S2 – Dukungan tingkat menengah
S3 – Zona pembalikan bawah, sering digunakan untuk entri long
S4 – Dukungan utama, potensi pemicu breakout
S5 – Zona target breakout ekstrem
Parameter
Periode Pivot – pilih Harian, Mingguan, atau Bulanan untuk perhitungan level
Lebar Garis – sesuaikan ketebalan garis secara keseluruhan
Gaya Garis – atur Solid, Titik, atau Garis Putus
Offset Teks (Pips) – jarak antara garis dan label
Warna Bull (R) – warna untuk level resistensi (R1–R5)
Warna Bear (S) – warna untuk level dukungan (S1–S5)
Warna Pivot – warna untuk garis pivot pusat (PP)
Tampilkan Tag – tampilkan atau sembunyikan nama level R/S
Tampilkan Harga – tampilkan atau sembunyikan label harga numerik
Cara Menggunakan
Zona R3–S3 → area pembalikan intraday khas
Level R4–S4 → konfirmasi breakout atau kelanjutan
R5–S5 → target volatilitas tinggi dan zona kelelahan
Ringkasan
Key features include automatic plotting of historical pivot levels for context, customizable line width, style, and colors for bullish, bearish, and neutral regimes, and options to show or hide level labels and price values. The indicator is lightweight, non-repainting, and compatible with various chart types such as time, range, tick, and Renko charts.
Camarilla levels serve specific roles: R3–S3 zones indicate typical intraday reversal areas; R4–S4 levels suggest breakout or continuation confirmations; and R5–S5 mark extreme breakout targets and high-volatility exhaustion zones. This tool provides a clear structural map to assist traders in identifying potential reversals, breakouts, and target zones across multiple markets including Forex, indices, commodities, cryptocurrencies, and stocks.
Ulasan pelanggan
5 | 100 % | |
4 | 0 % | |
3 | 0 % | |
2 | 0 % | |
1 | 0 % |


![Logo "Smart Money Concepts (SMC) [Iridio Capital]"](https://cdn.ctrader.com/image/webp/28b69fd1-ef54-4bed-9487-07e78e883be4_40934)


