
Price Level DWM BT
Indikator
Versi 1.0, Dec 2025
Windows, Mac
4.7
Ulasan: 4
Deskripsi
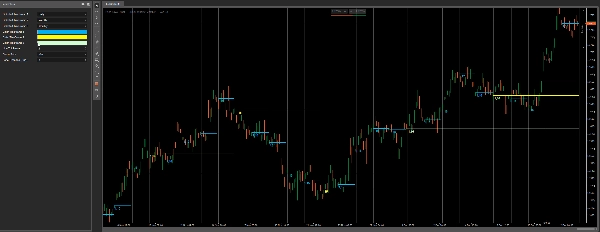
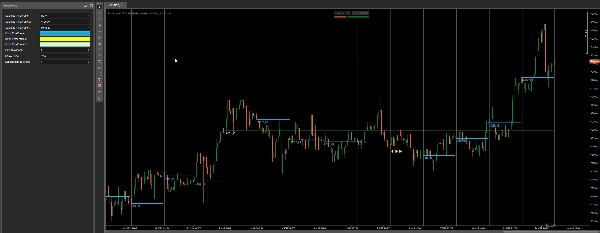
Level Harga DWM oleh Bullitt Traders
Level Harga DWM Level Perubahan Harga Harian Mingguan Bulanan memplot level referensi timeframe lebih tinggi secara bersih langsung ke grafik Anda — sehingga Anda selalu tahu posisi harga relatif terhadap tolok ukur Harian, Mingguan, dan Bulanan utama.
Level-level ini banyak digunakan untuk:
- konteks bias & arah
- reaksi support/resistance intraday
- keputusan mean-reversion vs. kelanjutan
- “trading lokasi” (di mana harga diperdagangkan vs. timeframe lebih tinggi)
Jaga grafik Anda minimal, cepat dan mudah dibaca sambil tetap memiliki konteks HTF dalam pandangan.
Apa yang Anda dapatkan
- Hingga 3 level referensi timeframe lebih tinggi secara bersamaan
- Harian / Mingguan / Bulanan dapat dipilih melalui dropdown
- Warna terpisah per timeframe
- Ketebalan dapat disesuaikan
- Label harga opsional (bersih dan tidak mengganggu)
Fitur Utama
- Plotting level HTF minimalis (dirancang untuk grafik yang bersih)
- Level referensi non-repainting (berdasarkan data HTF yang sudah selesai)
- Bekerja dengan baik dengan sesi, zona S&D, struktur pasar, alat ICT dan lainnya
- Cocok untuk FX, indeks, emas — pasar apa pun
Pengaturan
- Pilih TimeFrame 1 / 2 / 3
- Warna per timeframe
- Ketebalan garis
- Tampilkan label harga (on/off)
- Jarak label (offset visual)
Catatan
- Menggunakan data timeframe lebih tinggi yang sudah selesai untuk menjaga level tetap stabil dan konsisten.
Ringkasan
Profil indikator
Kategori indikator
Volatilitas
Tipe output
Sinyal
Persyaratan data
Data eksternal
Sinyal yang didukung
Level tertembus
Ulasan pelanggan
4.7
Ulasan: 4
5 | 75 % | |
4 | 25 % | |
3 | 0 % | |
2 | 0 % | |
1 | 0 % |
Ulasan pelanggan
February 9, 2026
Price Level DWM BT provides clean and accurate daily, weekly and monthly levels. Best used from M5 and higher timeframes, where levels stay readable and meaningful. A great context tool for intraday and swing traders who rely on higher-TF structure, reactions and trade planning.
December 18, 2025
The setup needs less second guessing, but overconfidence is the real danger.
December 15, 2025
pretty fine as one more layer, especially in mixed charts. A few signals across sessions tell more.
Diskusi
Pertanyaan umum
Prop
Forex
Signal
Breakout
Scalping
Commodities
Crypto
Produk-produk yang tersedia melalui cTrader Store, termasuk bot trading, indikator, dan plugin, disediakan oleh pengembang pihak ketiga serta hanya ditujukan untuk akses teknis dan informasi. cTrader Store bukan broker dan tidak menyediakan saran investasi, rekomendasi pribadi, atau jaminan apa pun tentang kinerja di masa mendatang.


Harga
48
Penjualan
1.05K
Instal gratis