Deskripsi
Ini bukan Indikator Volume Delta biasa Anda. Ini adalah Indikator Volume Delta Level 2 DOM — Aliran Pesanan Kelas Institusional untuk cTrader. Keunggulan yang Dibayar Jutaan oleh Institusi.
Masalah yang Dihadapi Setiap Trader Ritel. Sebuah candle ditutup hijau. Volume tinggi. Anda membeli.
Harga berbalik seketika. Anda terkena stop out. Grafik "berbohong" kepada Anda.
Sebenarnya tidak berbohong — Anda hanya tidak bisa melihat apa yang terjadi di dalam candle. Batang hijau itu dengan volume tinggi? 70% dari volume itu adalah penjualan agresif. Penutupan didukung oleh lapisan tipis order beli di bagian bawah rentang. Institusi sedang mendistribusikan ke dalam order beli Anda.
Indikator volume standar menunjukkan totalnya. Mereka tidak pernah menunjukkan siapa yang mengendalikan.
Volume Delta mengubah itu. Apa yang Sebenarnya Ditunjukkan Volume Delta
Volume Delta memisahkan volume setiap bar menjadi volume beli dan volume jual, lalu menghitung selisihnya — yaitu delta. Delta positif berarti pembeli lebih agresif. Delta negatif berarti penjual mendominasi.
Ini adalah informasi paling penting yang membedakan trader profesional dari trader ritel: bukan berapa banyak yang diperdagangkan, tetapi sisi mana yang berdagang lebih agresif. Itulah keyakinan. Delta adalah sidik jari niat di balik setiap batang harga.
Tapi tidak berhenti di situ
Indikator ini tidak menebak. Dalam campuran data kepemilikan, ia membaca data Kedalaman Pasar Level 2 — buku order sebenarnya yang ada di balik harga yang Anda lihat di layar.
Data Level 2 (juga dikenal sebagai DOM — Depth of Market) menunjukkan order beli dan jual nyata yang tertumpuk di setiap level harga. Bukan perdagangan terakhir. Bukan perkiraan. Likuiditas yang sebenarnya dari bank, hedge fund, dan meja institusional yang mengalir melalui penyedia likuiditas broker Anda.
Hasilnya adalah tingkat akurasi 85-95% dalam mengklasifikasikan volume beli versus jual — jauh melampaui apa yang dapat dicapai oleh pendekatan berbasis rumus manapun.
Mengapa Ini Penting — Apa yang Dilihat Institusi yang Tidak Anda Lihat
Goldman Sachs, Citadel, Jump Trading — mereka semua berdagang dengan data aliran order. Mereka melihat tekanan beli dan jual secara real time. Mereka melihat absorpsi. Mereka melihat saat sebuah level sedang dipertahankan. Mereka melihat saat delta menyimpang dari harga.
Mereka membayar jutaan untuk infrastruktur ini. Data feed, server yang ditempatkan bersama, alat kepemilikan.
Indikator ini membawa konsep inti yang sama ke grafik cTrader Anda. Bukan versi yang dilemahkan. Data Level 2 DOM sebenarnya dari kolam likuiditas broker Anda, diproses menjadi klasifikasi beli-versus-jual yang sama yang digunakan trader aliran order profesional.
Perbedaan antara trader ritel dan trader institusional bukanlah kecerdasan. Itu adalah informasi. Volume Delta menutup kesenjangan itu.
Untuk Siapa Ini
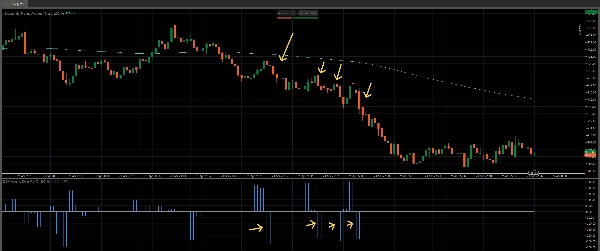
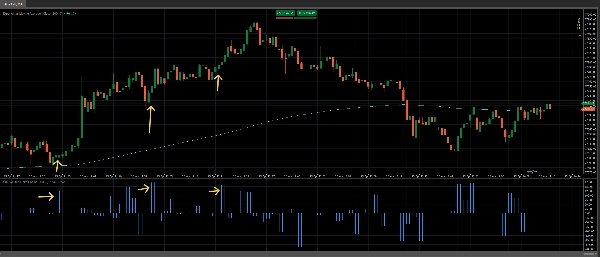
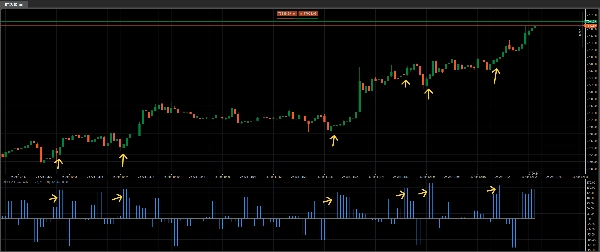
Trader harian yang ingin melihat di balik kebisingan. Ketika sebuah candle terlihat bullish tetapi delta negatif, Anda tahu untuk menunggu. Ketika sebuah candle terlihat lemah tetapi delta sangat positif, Anda tahu institusi sedang mengakumulasi. Delta tidak berbohong — ia menunjukkan apa yang terjadi, bukan bagaimana tampilannya.
Scalper yang perlu tahu sisi mana yang mengendalikan saat ini. Lonjakan delta pada breakout mengonfirmasi itu nyata. Breakout dengan delta datar memberi tahu Anda itu jebakan sebelum pembalikan bahkan dimulai.
Trader swing yang menginginkan konfluensi. Divergensi delta — di mana harga membuat titik rendah baru tetapi delta naik — adalah salah satu sinyal pembalikan paling dapat diandalkan dalam trading profesional. Indikator ini mendeteksinya secara otomatis.
Siapa pun yang berdagang forex, indeks, atau komoditas di cTrader dengan broker yang menyediakan data Level 2. Fusion Markets, IC Markets, Go Markets, dan broker ECN/STP serupa semuanya menyediakan data DOM yang dibaca indikator ini.
Jika Anda pernah berada di sisi yang salah dari candle "volume tinggi", ini adalah alat yang memberi tahu Anda mengapa.
Apa yang Anda Dapatkan
Histogram bersih dan profesional di bawah grafik Anda yang menunjukkan delta bersih untuk setiap bar, berdasarkan data yang sangat akurat. Bar positif berarti pembeli mendominasi. Bar negatif berarti penjual mendominasi. Ukuran bar menunjukkan berapa banyak satu sisi lebih unggul dari sisi lain. Digunakan bersama indikator seperti 200 ema memberikan konfluensi dan setup probabilitas tinggi.
Tidak ada kekacauan. Tidak ada rata-rata bergerak volume yang tertinggal. Tidak ada candle berwarna yang "memperkirakan" pembelian dan penjualan. Hanya perbedaan mentah dan tidak tersaring antara pembelian agresif dan penjualan agresif — dihitung dari sumber data terdalam yang tersedia bagi trader ritel.
Indikator ini juga menyediakan opsi untuk menggunakan filter volume agar hanya menampilkan bar yang paling penting. Bar volume agregat jika diinginkan.
Sekilas pada bar delta memberi tahu Anda apa yang coba diperkirakan oleh sepuluh indikator lain. Dapatkan sekarang untuk cTrader. Ini adalah keputusan mudah dengan harga rendah ini.
Gabungkan ini dengan indikator Volume Profile Pro kami untuk keputusan yang lebih baik di level kunci: https://ctrader.com/products/4079
Lihat Bot Black Box luar biasa kami di sini: https://ctrader.com/products/3241
Ringkasan
The indicator displays a clean histogram below the chart representing net volume delta per bar: positive bars indicate buyer dominance, negative bars indicate seller dominance, and bar size reflects the strength of that dominance. This provides traders with insight into market intent beyond total volume, revealing whether buyers or sellers controlled the price action.
It supports forex, indices, and commodities trading with brokers offering Level 2 data, such as Fusion Markets and IC Markets. Features include volume filtering and aggregated volume bars. The tool is suited for day traders, scalpers, and swing traders seeking to interpret order flow, confirm breakouts, detect divergences, and enhance decision-making with professional-level order flow data.
Ulasan pelanggan
5 | 50 % | |
4 | 50 % | |
3 | 0 % | |
2 | 0 % | |
1 | 0 % |