
(ViPi) MTF Candles
インジケーター
106 ダウンロード数
バージョン 1.0、Feb 2026
Windows、Mac
説明
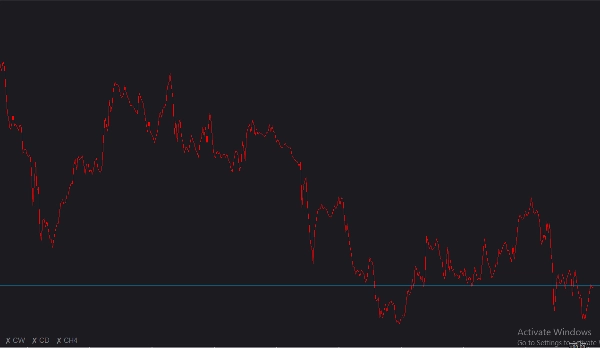
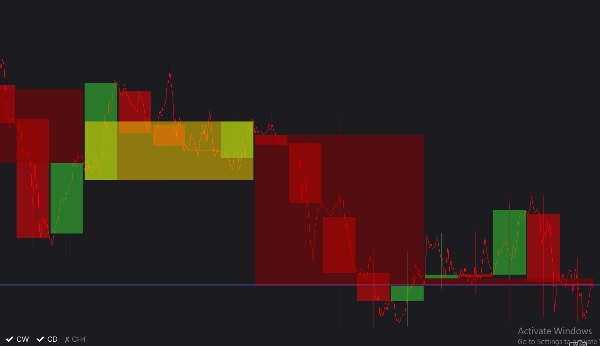
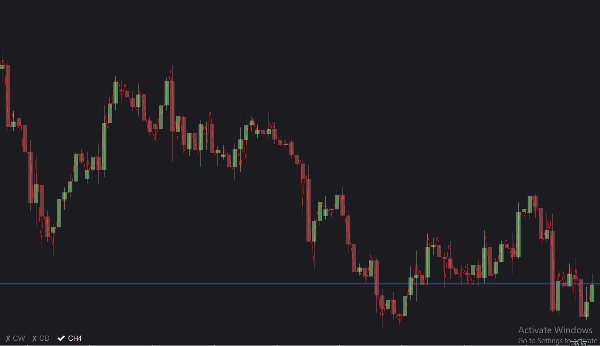
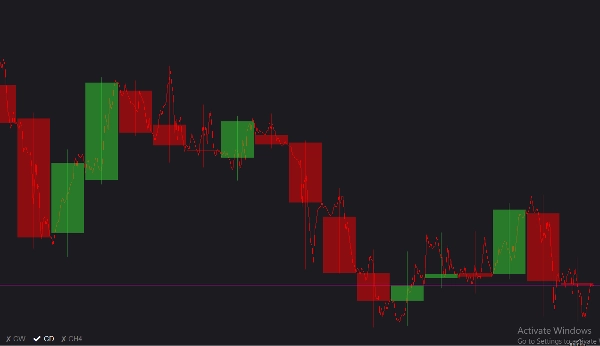
詳細な紹介 (ViPi) MTFキャンドルは、トレーダーにトップダウンの市場視点を提供し、アクティブなチャートを離れることなく利用できる、高度にインタラクティブでカスタマイズ可能なチャートツールです。最大3つの異なる高時間足(MTF)キャンドルを現在のビューにシームレスに重ねることで、マクロ経済のトレンド、主要なサポート/レジスタンスレベル、市場の変化を一目で簡単に把握できます。洗練された非侵襲的なオンチャートトグルメニューを備えており、各時間足を即座に表示または非表示にできるため、作業スペースを清潔かつ集中した状態に保てます。
全パラメーターリスト
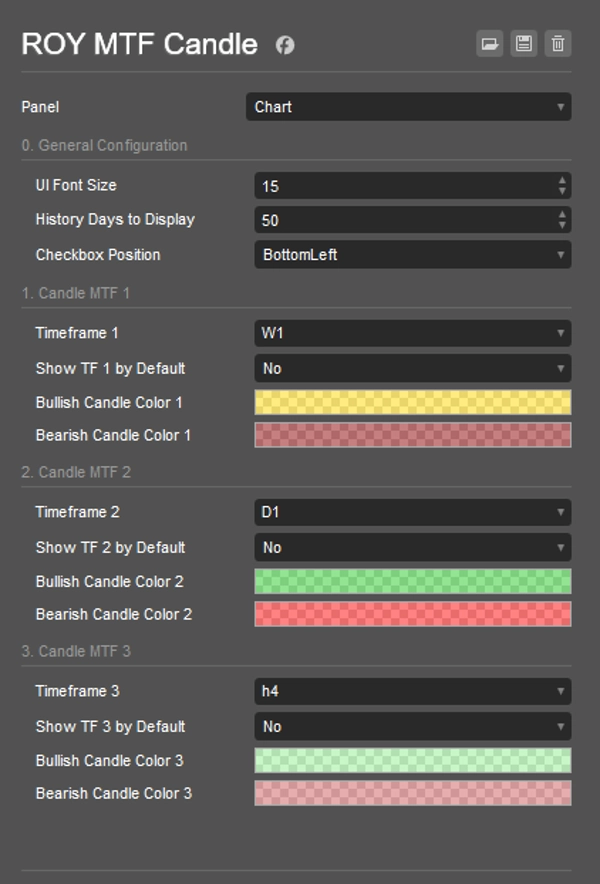
- UIフォントサイズ: オンチャートのインタラクティブトグルボタンのテキストサイズを調整します。8から30の間で設定可能(デフォルト:11)。
- 表示する履歴日数: インジケーターが過去のMTFキャンドルを描画する日数を決定します(デフォルト:50日)。
- チェックボックスの位置: UIトグルメニューをチャートの任意の隅に固定できます:左上、右上、左下、右下(デフォルト:左下)。
- 時間足 1、2、3: 監視したい特定の高時間足です。(デフォルトはそれぞれ週足、日足、4時間足)。
- デフォルトでTF 1、2、3を表示: インジケーターをチャートに適用した際に各時間足のキャンドルを即座に表示するかどうかを切り替えます(デフォルト:False)。
- 強気/弱気キャンドルの色: 3つの時間足それぞれの上昇および下降キャンドルの色を完全にカスタマイズでき、メインチャートを隠さないよう透明度もサポートしています。
使用ガイド
- チャートにアタッチ: (ViPi) MTFキャンドルインジケーターをアクティブなcTraderワークスペースに読み込みます。
- 時間足の設定: 設定を開き、現在の時間足と並行して監視したい最大3つのマクロ時間足(例:週足、日足、4時間足)を選択します。
- ビジュアルのカスタマイズ: 各時間足の強気および弱気キャンドルの色と透明度を調整し、背景とよく対比するようにします。
- 表示の切り替えを即座に: 選択したチェックボックスの位置にある便利なオンチャートのインタラクティブボタンを使って、分析中に特定のMTFオーバーレイを素早くオン・オフ切り替えできます。
概要
AIによる概要
(ViPi) MTF Candles is a charting indicator for cTrader that overlays up to three higher timeframe (multi-timeframe, MTF) candlestick charts directly onto the current chart. This tool enables traders to analyze broader market trends, key support and resistance levels, and shifts in market sentiment without switching charts. Users can customize the displayed timeframes—commonly Weekly, Daily, and 4-hour—and adjust the number of historical days shown. The indicator includes an on-chart toggle menu, which can be positioned in any corner of the chart, allowing quick visibility control of each timeframe overlay. Visual customization options include adjustable font sizes for toggle buttons and configurable bullish/bearish candle colors with transparency settings to maintain chart clarity. This facilitates a streamlined, interactive top-down market perspective suitable for various markets including Forex, indices, commodities, stocks, and cryptocurrencies.
インジケーターのプロフィール
カスタマーレビュー
0.0
レビュー: 0
カスタマーレビュー
この商品にはまだレビューがありません。お使いになったことがある方は、ぜひレビューをお願いします。
ディスカッション
よくあるご質問
BTCUSD
Forex
Indices
EURUSD
Commodities
GBPUSD
NZDUSD
Crypto
Stocks
XAUUSD
NAS100
USDJPY
cTrader Storeで入手可能な取引ボット、インジケーター、プラグインなどの商品は、第三者の開発者が提供するものであり、情報と技術の取得のみを目的としてご利用いただけます。cTrader Storeはブローカーではなく、投資助言や個人的な推奨を行うことも、将来のパフォーマンスを保証することもありません。
この作成者の他の商品


価格
登録日 12/06/2025
1
販売
336
無料インストール