present
Inscrivez-vous et bénéficiez d'une remise de 50 $ sur votre premier achat
Trading product for HIO RSI Multi Currency Scanner Pro Indicateur RSI Volume, image 1
HIO RSI Multi Currency Scanner Pro
Indicateur
Version 1.1, May 2026
Windows, Mac
4.7
Avis : 4
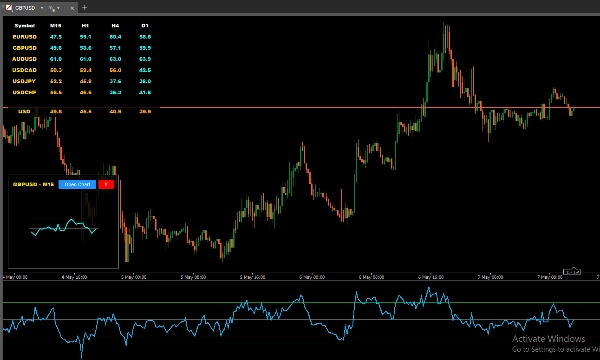
Trading product for HIO RSI Multi Currency Scanner Pro Indicateur RSI Volume, image 2
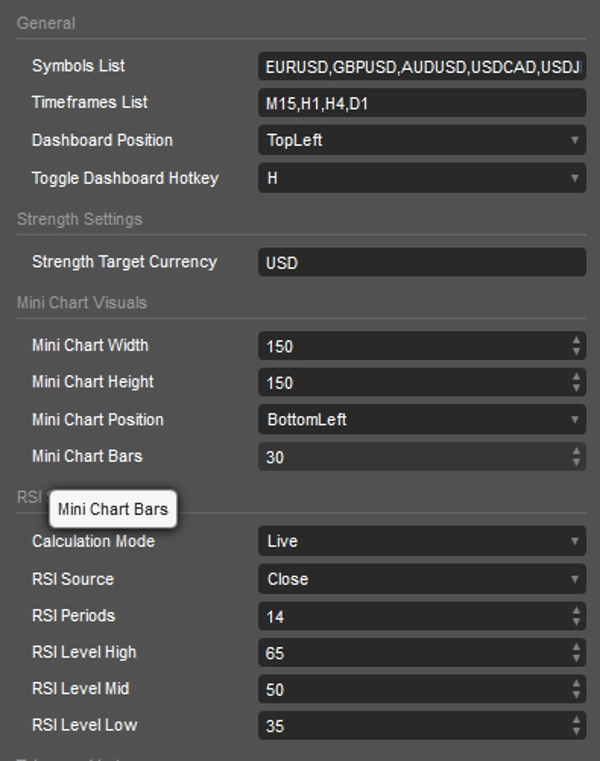
Trading product for HIO RSI Multi Currency Scanner Pro Indicateur RSI Volume, image 3
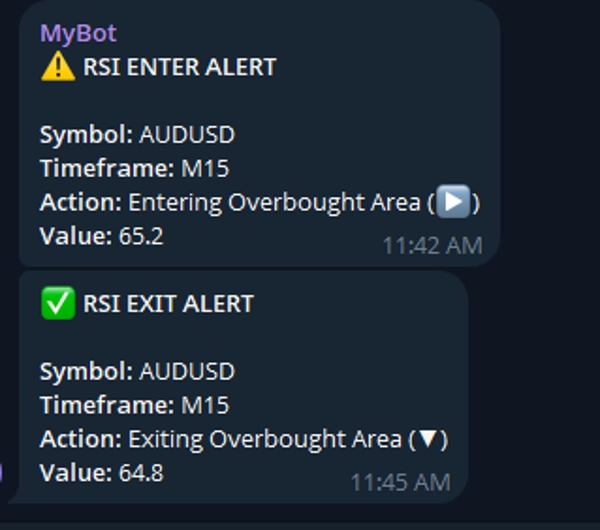
Trading product for HIO RSI Multi Currency Scanner Pro Indicateur RSI Volume, image 4
Trading product for HIO RSI Multi Currency Scanner Pro Indicateur RSI Volume, image 5
Depuis le 12/06/2025
1
Ventes
448
Installations gratuites

Description

Le HIO RSI Multi Currency Scanner Pro est un tableau de bord analytique conçu pour vous aider à surveiller le momentum du marché. Au lieu de passer d’un graphique à un autre, cet outil offre une vue consolidée pour suivre simultanément les niveaux de RSI sur divers symboles et périodes. Il est conçu pour aider les traders à identifier efficacement les conditions du marché.

Fonctionnalités clés

  • Intégration de la force des devises : Calcule la force pondérée d’une devise cible basée sur le RSI et le volume à travers les paires sélectionnées.
  • Mini-graphiques interactifs : Cliquez sur n’importe quelle cellule de données pour voir un mini-graphique popup instantané de l’historique du RSI sans quitter votre espace de travail actuel.
  • Alertes intelligentes : Recevez une notification lorsque le RSI entre ou sort de zones extrêmes spécifiques via l’intégration de messagerie.
  • Modes de calcul doubles : Choisissez entre Live pour un suivi en temps réel ou BarClose pour des mises à jour à la clôture des chandeliers.
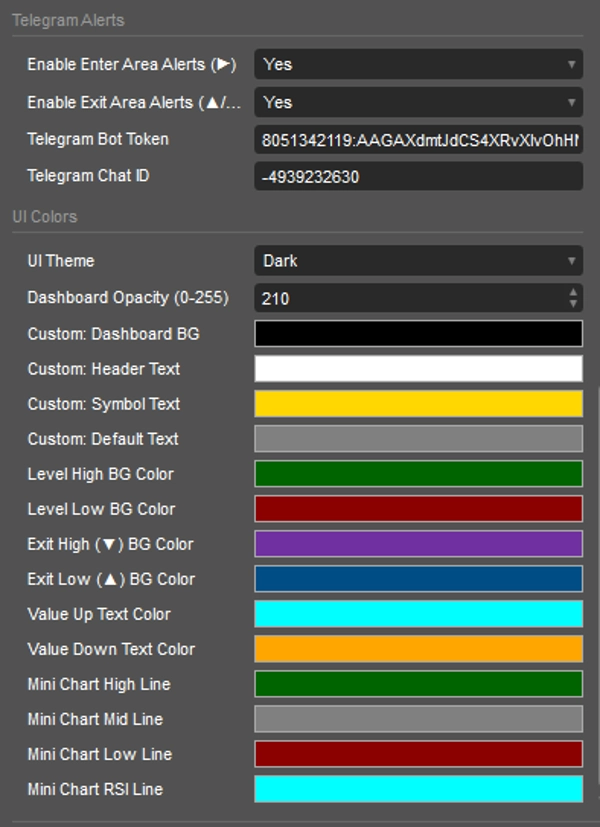
  • Interface personnalisable : Support pour les thèmes Sombre, Clair et Personnalisé avec opacité ajustable et une touche de raccourci dédiée pour basculer la visibilité du tableau de bord.

Alertes visuelles & logique des couleurs

Le tableau de bord utilise un système de codage couleur intuitif pour vous aider à lire rapidement les conditions du marché :

  • Couleurs de fond (zones) :
    • Vert foncé / Rouge foncé : Le RSI est actuellement dans la zone de surachat / survente.
    • Violet / Bleu : Le RSI vient de sortir de la zone de surachat / survente.
  • Couleurs du texte (momentum) : Aqua / Orange : La valeur du RSI est en hausse / en baisse par rapport à la bougie précédente.
  • Indicateurs directionnels : Le texte se met à jour dynamiquement pour indiquer si le RSI entre ou sort des zones.

(Note : l’interface et les couleurs du texte sont entièrement personnalisables via les paramètres)

Configuration & paramètres

  • Général : Définissez votre liste de symboles et votre liste de périodes. Réglez la position du tableau de bord et votre touche de raccourci préférée.
  • Noyau RSI : Ajustez les périodes du RSI, sélectionnez la source du RSI et définissez des seuils spécifiques pour les niveaux Haut, Moyen et Bas.
  • Paramètres de force : Saisissez votre devise cible pour surveiller son momentum global.
  • Notifications : Saisissez vos paramètres pour activer les notifications à distance pour les alertes d’entrée ou de sortie.

Améliorez votre routine de trading avec un outil conçu pour la clarté. Le HIO RSI Multi Currency Scanner Pro est conçu pour optimiser votre processus de surveillance multi-actifs.

Résumé

Résumé IA
The HIO RSI Multi Currency Scanner Pro is an analytical dashboard designed for monitoring Relative Strength Index (RSI) levels across multiple symbols and timeframes simultaneously. It consolidates market momentum data into a single interface, reducing the need to switch between charts. Key features include currency strength integration, which calculates weighted strength of a target currency based on RSI and volume across selected pairs. The tool offers interactive mini-charts accessible via clickable data cells, enabling quick RSI history review without leaving the workspace. It supports smart alerts that notify users when RSI enters or exits specified extreme zones through messaging integration. Users can select between live real-time tracking or updates upon candle close with dual calculation modes. The customizable user interface supports dark, light, and custom themes, adjustable opacity, and a hotkey to toggle dashboard visibility. Visual alerts use color-coded backgrounds and text to indicate RSI zones and momentum changes, with full customization available. Setup options allow defining symbols and timeframes, adjusting RSI parameters, setting target currencies for strength monitoring, and configuring remote notifications. This tool is intended to streamline multi-asset RSI monitoring for traders seeking a comprehensive momentum overview.
Profil de l'indicateur
Catégorie de l'indicateur
Dynamique
Type de résultat
Visualisation
Signaux
Filtre
Exigences en matière de données
Barres seulement
Données de tick
Volume
Signaux pris en charge
Croisement
Inversion

Discussion

Avis clients

4.7
Avis : 4
5
75 %
4
25 %
3
0 %
2
0 %
1
0 %
Avis clients
May 20, 2026
A 12 trade note set is enough for first impressions. It keeps the review from getting sloppy.
May 18, 2026
H1 makes the signal less noisy. The setup gets an extra sanity check.
May 18, 2026
ngl, timing feels less random and that is enough to keep testing it. M15 is enough for the first pass.
May 15, 2026
No reason to yolo this live without a few normal sessions. It needs a few bad trades in the sample too.

Questions fréquentes

RSI
Volume
Les produits disponibles sur cTrader Store, notamment les bots de trading, les indicateurs et les plug-ins, sont fournis par des développeurs tiers et mis à disposition à titre informatif et à des fins d'accès technique uniquement. cTrader Store n'est pas un courtier et ne fournit aucun conseil en investissement, aucune recommandation personnelle ni aucune garantie quant aux performances futures.

Plus de cet auteur
Indicateur
Forex
BTCUSD
+9
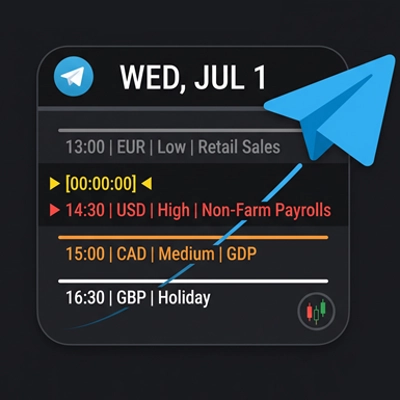
On-chart economic calendar with custom filters and automated Telegram alerts. Never miss high-impact news!
Indicateur
Forex
BTCUSD
+13
Multi-symbol Inside Bar Scanner with dashboard & breakout alerts
Indicateur
Forex
BTCUSD
+10
(ViPi) MTF Candle displays multiple higher timeframe candles right on your current chart for ultimate trend analysis.
Indicateur
Prop
Forex
+14
Pro Inside Bar Scanner with smart Telegram alerts & multi-timeframe dashboard
Indicateur
Volume
Stochastic
Multi-symbol & multi-timeframe Stochastic scanner with interactive mini-charts and Telegram alerts
Indicateur
CCI
Volume
Monitor multiple pairs and timeframes with this interactive CCI dashboard. Includes mini-charts & Alerts.
Indicateur
Key Levels
Display live economic events directly on your chart with impact filters and automated advance notifications.

Vous pourriez aussi aimer

Indicateur
Auto Fibonacci Retracement Indicator for cTrader
Indicateur
SmartFibonacci — automatic Fibonacci retracements & extensions with swing detection, alerts and clean labels for cTrader
Indicateur
RSI
RSI on the main chart with 45/55 momentum levels, overbought/oversold levels, averaged RSI, and multi-timeframe support.
Indicateur
XAUUSD
Commodities
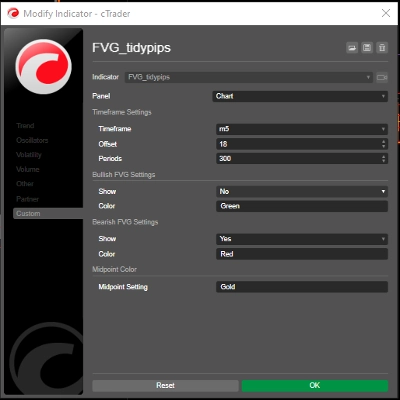
A Fair Value Gap (FVG) indicator that identifies potential price imbalances, potential reversal and continuation zones
Indicateur
AI
ATR
+26
Exploit market imbalances with auto FVG zones—fade, extend, and filter with precision.
Indicateur
Prop
Forex
+9
Trend Sniper — session-based tool highlighting live session ranges and adaptive Custom line.
Indicateur
AI
RSI
+18
Session boxes with UTC offset, OR logic, adjustable opacity, and multi-day lookback.
Indicateur
Drawdown Monitor
Proprietary trading desk risk monitoring dashboard!
Indicateur
Prop
Forex
+12
Introducing High Accuracy multi timeframe Swing high and low detector.
Indicateur
Key Levels
Support & Resistance
Clean psychological round-number grid with native pip and point auto-scaling across Forex, Gold, Indices, and Crypto.
Indicateur
ATR
Wedge
+2
Strong Supertrend Turn Market Movement into a Clear Map Market analysis
Indicateur
ATR
BOS
+4
Based on market structure and draws liquidity zones, institutional flows, and consolidation ranges. Smart Money Concepts
Logo de "Swing Points"
Les mieux notés
4.5
(6)
$19
Indicateur
AI
SMC
+15
Multi-Timeframe Swing Points Indicator for cTrader that identifies swing highs and lows on both the current timeframe.
Logo de "Zigzag Trend"
Les mieux notés
4.5
(4)
$25
/
$45
Indicateur
AI
ATR
+23
The ZigZag Trend is a market structure tool that filters out small price fluctuations and highlights major swing.
Indicateur
VWAP
Support & Resistance
Trading.FC$_vwap Algo shows VWAP trends, dynamic support/resistance and deviation bands to spot potential trade entries.
Indicateur
AI
Prop
+7
EMA Clouds, Multi-Timeframe (MTF) Overlay, Swing High/Low detection, and a smart Dashboard with neutral zone filtering.
Indicateur
Aggressive
Supertrend
+5
Stop trading with tunnel vision! 🚫 The Heat Map Dashboard is an institutional-grade visual trading assistant
Indicateur
ATR
RSI
+1
Super Trend Rsi ,ATR + trend change distance + dynamic Alpha, divergence/convergence

Prix

Depuis le 12/06/2025
1
Ventes
448
Installations gratuites