present
가입하고 첫 구매 시 $50 할인을 받으세요
Trading product for PulseFlow Imbalance Sessions and ADR 지표 Fair Value Gap Key Levels, image 1
PulseFlow Imbalance Sessions and ADR
지표
버전 1.0, Oct 2026
Windows, Mac
Trading product for PulseFlow Imbalance Sessions and ADR 지표 Fair Value Gap Key Levels, image 2
Trading product for PulseFlow Imbalance Sessions and ADR 지표 Fair Value Gap Key Levels, image 3
Trading product for PulseFlow Imbalance Sessions and ADR 지표 Fair Value Gap Key Levels, image 4
가입일 14/10/2026

설명

출시 가격: 2026년 11월 14일까지 $19. 그 이후에는 가격이 $33로 돌아갑니다.

왼쪽에 중요한 것이 숨겨져 있지 않은 깔끔한 차트


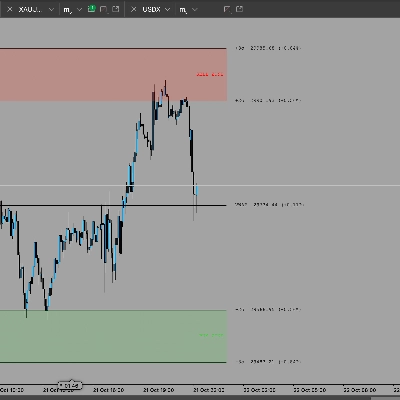
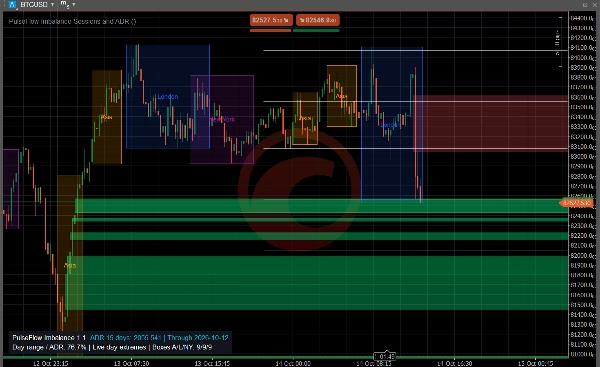
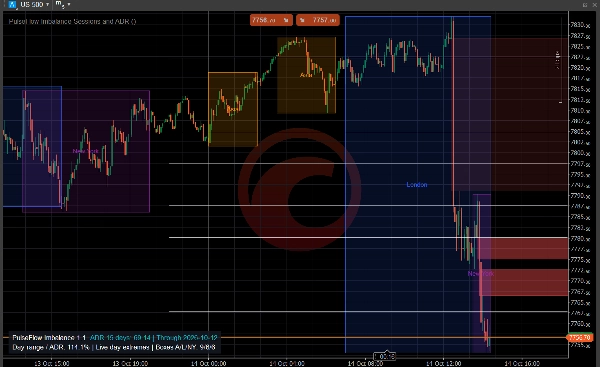
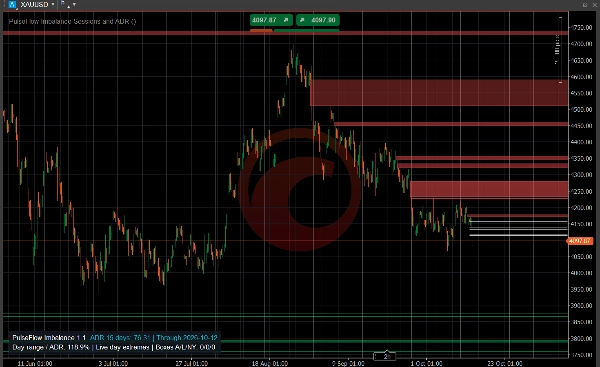
PulseFlow Imbalance Sessions 및 ADR은 중요한 구조를 앞에 유지합니다: 열린 불균형 구역(공정 가치 갭), 손대지 않은 세션 최고점과 최저점, 그리고 하루가 평균 범위에 대해 얼마나 이동했는지. 차트를 한눈에 읽을 수 있으며, 시간을 되돌려 볼 필요가 없습니다. 명확한 참조로 더 나은 결정을 내리는 데 도움이 됩니다.


필요했던 구역, 왼쪽으로 사라진

빠른 움직임은 불균형을 남깁니다. 가격이 다시 돌아올 때쯤이면 화면 밖에 있을 수 있고, 그것이 채워졌는지 궁금해질 수 있습니다. 여기서는 열린 구역이 가격이 채울 때까지 화면에 남아 있습니다.


아직 열려 있는 것만

- 강세 구역은 녹색, 약세 구역은 빨간색으로 표시되며 오른쪽으로 확장됩니다.

- 평균 일일 범위(ADR)와 비교해 작은 갭은 무시되어 의미 있는 구역만 그려집니다.

- 가격이 다시 거래되면서 구역은 실시간으로 축소되고 완전히 채워지면 사라집니다.

- 각 구역의 음영은 그것을 만든 움직임 뒤의 거래량을 보여줍니다: 거래량이 낮을 때는 어둡고, 높을 때는 밝습니다. 거래량은 cTrader 틱 거래량에서 가져옵니다.


하루의 지도

- 박스는 아시아(도쿄), 런던, 뉴욕 세션을 각각 고유한 색상으로 표시합니다.

- 점선은 각 종료된 세션의 최고점과 최저점에 머물며 가격이 닿을 때까지 유지됩니다.

- ADR 예상치는 평균 일일 범위의 50%, 75%, 100%를 나타내며, 하루의 최저점과 최고점 또는 하루 시작점에서 측정되어 하루가 얼마나 이동했는지 보여줍니다.

- 컴팩트한 패널은 현재 ADR과 하루가 이미 이동한 비율을 보여줍니다.


그 다음은 당신의 해석입니다

가격이 열린 구역이나 세션 레벨로 돌아올 때 어떻게 반응하는지 관찰하세요: 멈춤, 거부 또는 완전 채움. 선택적 cTrader 팝업 알림은 새로운 불균형, ADR 대비 큰 불균형, 첫 접촉, 부분 채움 및 완전 채움에 대해 알려주어 화면에서 벗어날 수 있게 도와줍니다.


유형, 도구 및 시간 프레임

시장 구조를 위한 차트 오버레이 지표: 불균형 구역, 세션 레벨 및 일일 범위 예상치. 주식 지수, 외환, 금, 암호화폐 등 캔들이 있는 모든 시장에서 작동합니다. 불균형 구역은 모든 표준 시간 기반 차트에서 작동합니다. 세션 박스는 인트라데이 차트가 필요하며 1시간 차트까지 가장 잘 읽힙니다. ADR 예상치는 인트라데이 및 일간 차트에서 사용할 수 있습니다. 틱, 렌코, 범위 및 헤이킨 아시 차트는 지원되지 않습니다.


유의 사항

구역은 움직임 후 세 번째 캔들이 닫힐 때 그려지며, 미리 그려지지 않습니다. 세션은 휴일 달력이 없는 시계 창이며 끌 수 있습니다. ADR은 완료된 날들의 평균이며 가격이 반드시 지켜야 할 한계가 아닙니다. 구역과 레벨은 참조용이며 진입, 손절 또는 목표가 아니며 가격이 무시할 수도 있습니다.


거래에는 위험이 따릅니다. 과거 실적이 미래 결과를 보장하지 않습니다.

요약

지표 프로필
지표 카테고리
시장 구조 (SMC)
출력 유형
시각화
데이터 요구 사항
막대만
지원되는 신호
레벨 터치

상담

고객 리뷰

0.0
리뷰: 0
고객 리뷰
이 상품에 대한 리뷰가 아직 없습니다. 이미 사용해 보셨나요? 다른 사람들에게 가장 먼저 소개해 주세요!

자주 묻는 질문(FAQ)

Fair Value Gap
Key Levels
Imbalance
트레이딩 봇, 지표, 플러그인 등 cTrader Store에서 제공되는 상품은 제3자 개발자에 의해 제공되며, 이는 단순히 정보 및 기술적 접근을 목적으로 제공된 것입니다. cTrader Store는 중개인이 아니며, 투자 조언, 개인별 추천 또는 향후 성과에 대한 어떠한 보장도 제공하지 않습니다.

이 작성자의 상품 더 보기

지표
RSI
Fibonacci
+1
Spot RSI divergences on your chart and get an entry, stop and six targets when your filters line up.
지표
Key Levels
Market Structure
+1
See the day's percentage targets from the open, so you know where the session stands at a glance.
지표
Key Levels
Support & Resistance
Add your provider's gamma levels by hand or automatically with our feed plugin, and see the gamma regime at a glance.
데스크톱 플러그인
External Data
HTTP Requests
Load live gamma levels from your own QuantWheel API key into PulseFlow Gamma Regime, with no more typing by hand.

좋아하실 만한 다른 항목

지표
BOS
CHOCH
+5
A professional-grade cTrader indicator for traders following the Inner Circle Trader (ICT) methodology.
지표
Drawdown Monitor
Protect your funded account. Real-time Daily Equity Drawdown monitor with Green / Orange / Red flashing alerts.
지표
Forex
BTCUSD
+5
Auto-plots Open, High, and Low of Day/Week/Month/Year. Session candle counter + Round Numbers. Fully customizable
지표
RSI
Breakout
+1
"Identify key market zones and visualize support/resistance from multiple timeframes on a single chart.
지표
AI
ATR
+27
Smart Money Gaps: MTF FVG auto-detection, extension, and mitigation marker. Trade institutional imbalances.
지표
ATR
VWAP
+4
Structure-aware indicator that re-anchors VWAP to confirmed swing pivots.
지표
Customizable window inside your platform, access to any website Calendar
지표
RSI
MACD
+2
A straightforward yet effective tool signals entry points for both buying and selling. Include 3 Moving Average
지표
ATR
EMA
+5
Candle timer with live profit tracking on chart – displays pips, currency value, and percentage in real time.
지표
MACD
Forex
+5
🚀 MACD Pro Trader – Advanced MACD with buy/sell signals, custom MAs & color-coded histograms for smarter trading! 📈🔥
지표
Forex
GBPUSD
+5
Visual warning zones for high-impact news so you can manage risk before volatility hits.
지표
Prop
Forex
+5
Color Volume Bars – Visualize Market Strength Instantly
지표
RSI
Fibonacci
+1
Spot RSI divergences on your chart and get an entry, stop and six targets when your filters line up.
지표
Visually master the Inside Bar strategy with clear breakout signals and professional chart highlighting 📈🔔📉
지표
BOS
EMA
+5
VWAP Bands indicator with 3 standard deviation levels, buy/sell zones, and a draggable ON/OFF button to toggle the entir
지표
EMA
AI-assisted
+1
Multi EMA Timeframes lets you stay on your chart and see the exact EMA from any timeframe you choose — up to 5 at once.
지표
ATR
RSI
+5
Delta RSI Candle Pro, the indicator that transforms ordinary candlesticks into powerful momentum visualizers.
지표
RSI
MACD
+7
The ZigZag indicator is a technical analysis tool primarily used to identify key price reversal points.

가격

가입일 14/10/2026