present
가입하고 첫 구매 시 $50 할인을 받으세요
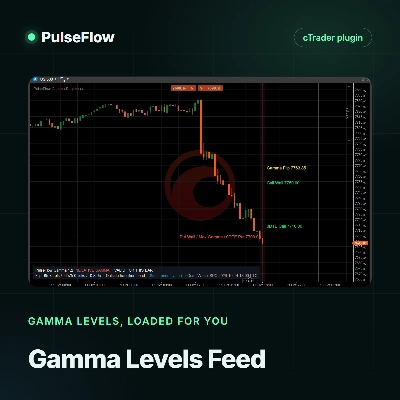
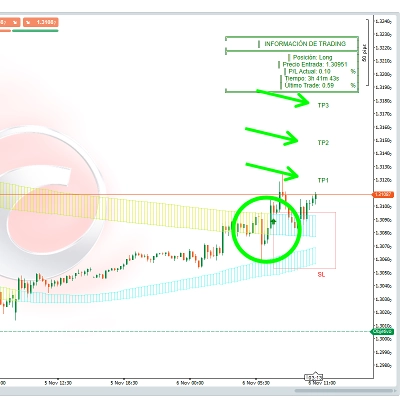
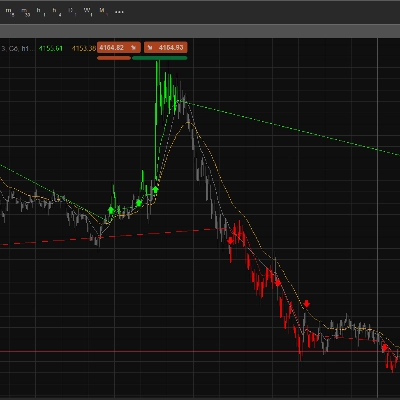
Trading product for PulseFlow RSI Deep Buyer-Seller 지표 Fibonacci Key Levels, image 1
PulseFlow RSI Deep Buyer-Seller
지표
버전 1.0, Oct 2026
Windows, Mac
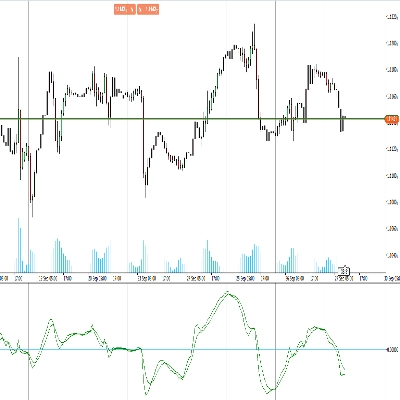
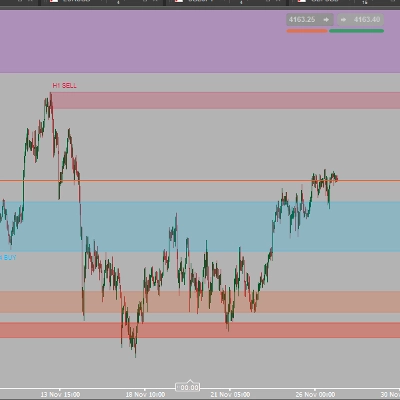
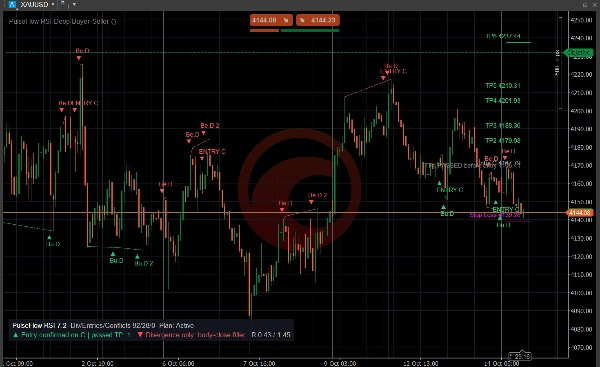
Trading product for PulseFlow RSI Deep Buyer-Seller 지표 Fibonacci Key Levels, image 2
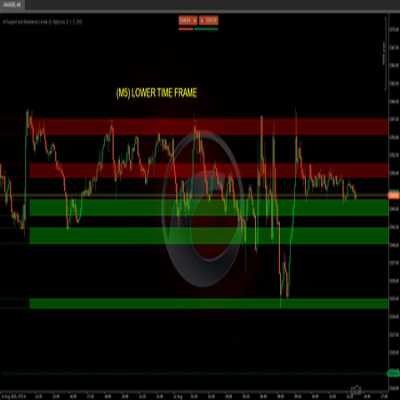
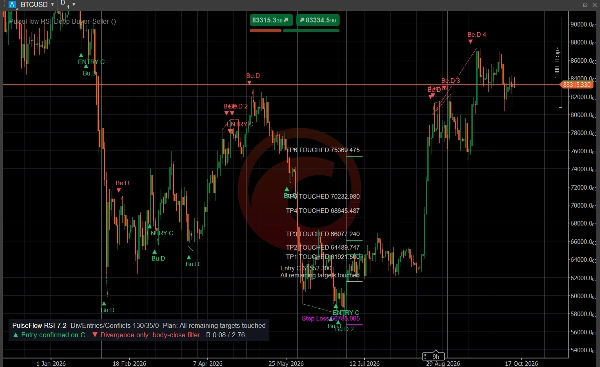
Trading product for PulseFlow RSI Deep Buyer-Seller 지표 Fibonacci Key Levels, image 3
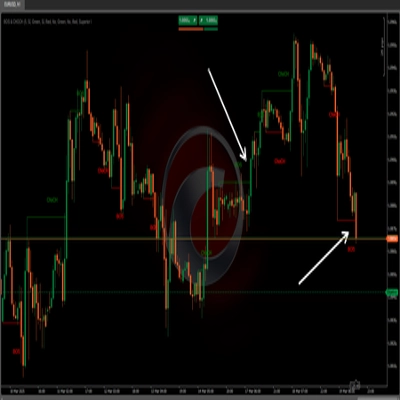
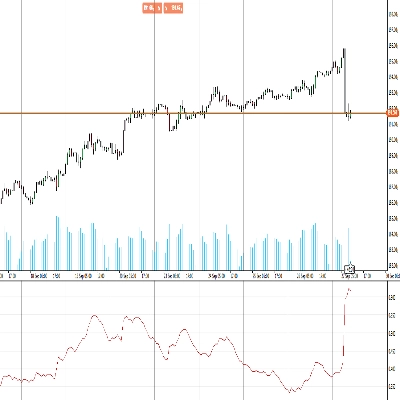
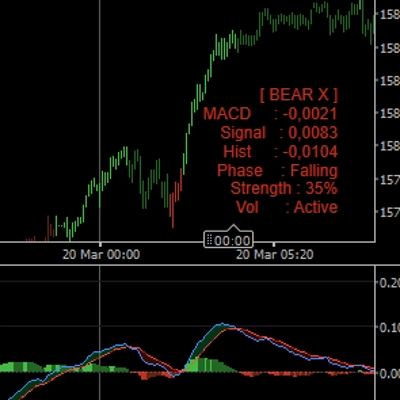
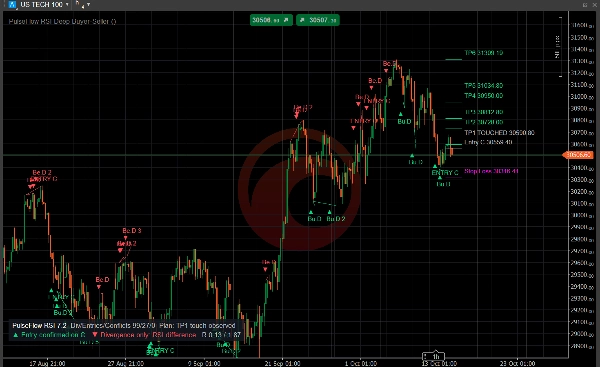
Trading product for PulseFlow RSI Deep Buyer-Seller 지표 Fibonacci Key Levels, image 4
가입일 14/10/2026

설명

Launch price: $19 until November 14, 2026. After that date, the price returns to $33.

Price keeps moving. Is momentum keeping up?


PulseFlow RSI Deep Buyer-Seller shows you when momentum stops confirming price. It marks RSI divergences directly on your chart, so you can recognize potential momentum shifts at a glance and plan your next move with clear references. It helps you make better decisions with more context.


From observation to a trade plan

- Bullish (Bu.D) and bearish (Be.D) divergence markers, with a dashed line from the origin to the endpoint of each divergence.

- Divergences that pass your entry filters are marked ENTRY C and get a full plan: entry reference, stop and six price targets.

- Targets already passed before the entry are shown in grey, and targets touched afterwards are labelled on the chart.


A chart that adapts to you

- Adjust RSI settings, entry filters, stop and target levels, colors and line length.

- Optional overbought and oversold markers, and optional markers for divergences that do not qualify as entries.

- A compact status panel at the bottom-left keeps the latest decision in view without covering the chart.


The latest plan in view

By default, only the latest qualified entry levels are shown. Enable historical trade levels in the settings to review previous setups.


Alerts

Optional cTrader pop-up alerts for new entries, new divergences, stop and target touches, and expired plans.


Type, instruments and timeframes

Chart overlay indicator for momentum and divergence analysis. It is designed for cryptocurrencies, stock indices, metals such as gold, and other non-forex markets, on H1 and higher timeframes. On forex pairs and below H1 it is less reliable. Markers and plans are drawn once the confirming bar has closed, at the open of the next bar.


Use it to organize your analysis and assess opportunities with clear references. The indicator does not open or manage trades. Trading involves risk. Past performance does not guarantee future results.


요약

지표 프로필
지표 카테고리
모멘텀
출력 유형
시각화
신호
데이터 요구 사항
막대만
지원되는 신호
다이버전스
반전
레벨 터치

상담

고객 리뷰

0.0
리뷰: 0
고객 리뷰
이 상품에 대한 리뷰가 아직 없습니다. 이미 사용해 보셨나요? 다른 사람들에게 가장 먼저 소개해 주세요!

자주 묻는 질문(FAQ)

Fibonacci
Key Levels
RSI
트레이딩 봇, 지표, 플러그인 등 cTrader Store에서 제공되는 상품은 제3자 개발자에 의해 제공되며, 이는 단순히 정보 및 기술적 접근을 목적으로 제공된 것입니다. cTrader Store는 중개인이 아니며, 투자 조언, 개인별 추천 또는 향후 성과에 대한 어떠한 보장도 제공하지 않습니다.

이 작성자의 상품 더 보기

지표
Key Levels
Market Structure
+1
See the day's percentage targets from the open, so you know where the session stands at a glance.
지표
Imbalance
Key Levels
+1
Keep open imbalance zones, untouched session highs and lows and the day's ADR range in view, without scrolling back.
지표
Key Levels
Support & Resistance
Add your provider's gamma levels by hand or automatically with our feed plugin, and see the gamma regime at a glance.
데스크톱 플러그인
External Data
HTTP Requests
Load live gamma levels from your own QuantWheel API key into PulseFlow Gamma Regime, with no more typing by hand.

좋아하실 만한 다른 항목

지표
ATR
EMA
+5
Candle timer with live profit tracking on chart – displays pips, currency value, and percentage in real time.
지표
AI
Signal
+1
🔥 THIS BURNS JP225 INDICATOR – Professional Trading Signals
지표
VWAP
Support & Resistance
Trading.FC$_vwap Algo shows VWAP trends, dynamic support/resistance and deviation bands to spot potential trade entries.
지표
Forex
cTrader Auto Support & Resistance detects key levels with Fibonacci analysis and sends real-time trading alerts.
지표
ATR
RSI
+6
Market structural patterns , specifically the concepts of Change of Character (ChoCH) 🔄 and Break of Structure (BoS) 💥
지표
Key Levels
Support & Resistance
Add your provider's gamma levels by hand or automatically with our feed plugin, and see the gamma regime at a glance.
지표
Forex
BTCUSD
+10
🎯Smart Signals : Auto Buy/Sell alerts with dynamic TP/SL algorithm. 💡
지표
Forex
BTCUSD
+10
Enhance trading with TSI! Use the True Strength Index for clear insights into market momentum and trend strength.
지표
Prop
Forex
+9
Trend Sniper — session-based tool highlighting live session ranges and adaptive Custom line.
지표
RSI
Breakout
+1
"Identify key market zones and visualize support/resistance from multiple timeframes on a single chart.
지표
ATR
Upgrade to ATR-RMA! Experience the precise ATR using Relative Moving Average for accurate volatility analysis in cTrader
지표
ADX
ATR
+2
GOLD SENTINEL v1.0 - A CANDLE-COLORING INDICATOR FOR GOLD.
지표
Supertrend
Moving Average
Adaptive MA anchored to structural trend changes — no fixed period. Dual Supertrend + swing detection.
지표
Prop
Forex
+10
Heatmap Pro analiza la volatilidad, el volumen y la acción del precio para "pintar" tu gráfico con zonas de color.
지표
Key Levels
Market Structure
+1
See the day's percentage targets from the open, so you know where the session stands at a glance.
지표
RSI
Breakout
+1
🚀 TrendHeikinMultiMA: Advanced trend detection using Heikin-Ashi smoothing & MAs! Eliminates noise, confirms real trend
지표
ATR
MACD
+15
MACD Advanced -- It combines the standard MACD logic with a rich set of visual tools
지표
Smart Liquidity Zones PRO auto-detects liquidity grabs, wicks, traps & manipulations — trade like the smart money.

가격

가입일 14/10/2026