
説明
cTrader用ドットモメンタム %BB ダイナミックビジュアライザー
ボラティリティを定量化。モメンタムを視覚化。エントリーをマスター。
ボラティリティの力を解き放つ ボリンジャーバンド %B ダイナミックビジュアライザーは、価格の動きをそのボラティリティの包絡線に対して比類なき洞察を提供するために設計されたcTrader専用のユニークなカスタムインジケーターです。従来のボリンジャーバンドを超え、このインジケーターは複雑なボラティリティ指標を直感的で色分けされた円のストリームに変換し、重要な市場の転換点やトレンドの強さを特定するのに役立ちます。
ボリンジャーバンド %Bとは何か、そしてそれはどう違うのか?
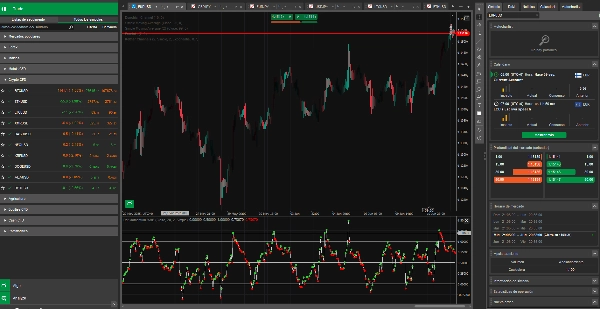
標準のボリンジャーバンドは価格チャートに直接重ねて表示され、動的なサポート/レジスタンスを示し、拡大・収縮を通じて市場のボラティリティを視覚的に表現しますが、ボリンジャーバンド %Bはオシレーターです。メインチャートの下の別パネルに表示され、現在の価格がどこに位置するかを定量的に示します。これはボリンジャーバンドの包絡線の内側にあります。
価格を直接表示するのではなく、0から1のスケールで価格の相対的な位置を示します:
- 0.0: 価格は下部のボリンジャーバンドにあります。
- 0.5: 価格は中央のボリンジャーバンド(移動平均)にあります。
- 1.0: 価格は上部のボリンジャーバンドにあります。
利点とボラティリティの文脈:
このインジケーターは単なる観察を超えています。価格の位置をその固有のボラティリティに対して定量化し、以下を可能にします:
- トレンドの強さを測定: %Bが0.5以上で持続する場合は強い上昇モメンタムを示し、0.5未満は下落圧力を示します。
- 潜在的な反転を特定: 極端な値(0.0または1.0に近い)は、価格が現在のボラティリティ範囲内で過度に伸びている可能性を示します。
- 文脈的なボラティリティを理解: ボラティリティ自体(基礎となるボリンジャーバンドの幅で表される)は常に 見ている時間枠に依存します。1時間チャートの%Bの読みは1日チャートとは異なるボラティリティを反映します。当インジケーターは選択した時間枠にシームレスに適応し、関連する洞察を提供します。
技術的特徴:
- 正確な計算: %Bは次のように計算されます:(現在の価格−下部バンド)/(上部バンド−下部バンド)
- 動的な色分け(円):
-
- ライムグリーンの円: %B値が前のバーから上昇していることを示し、上昇モメンタムを示します。
- 赤い円: %B値が前のバーから下降していることを示し、下降モメンタムを示します。
- 銀色の円: %B値が変わらないか、最初の有効なポイントのときに表示されます。
- 微妙なパスライン: 薄いライトグレーの線が%B値の全体的な軌跡を控えめにトレースし、動的な円の下に視覚的な連続性を提供します。
- 控えめなレベルマーカー: 0.0、0.5、1.0のダークグレーの実線(メインのビジュアライゼーションを圧倒しないように見やすく)で、ボラティリティの極端値と平均の明確な参照点を提供します。
- カスタマイズ可能: 設定から直接ボリンジャーバンドの期間、標準偏差、MAタイプを調整できます。
簡単な説明:過剰ボラティリティシグナル(ボラティリティのRSIのようなもの!)
このインジケーターは RSIのようなものですが、単純な買われ過ぎ/売られ過ぎの価格レベルではなく、ボラティリティの過剰伸長に対して機能します。
- 円が 0.0に触れるかそれ以下になると、価格が現在のボラティリティ包絡線の底に強く押し付けられていることを意味します。これは 「ボラティリティの売られ過ぎ」のシグナルであり、市場が 現在の文脈で下方向に過度に伸びている可能性を示唆します。
- 円が 1.0に触れるかそれ以上になると、価格が現在のボラティリティ包絡線の上部に強く押し付けられていることを意味します。これは 「ボラティリティの買われ過ぎ」のシグナルであり、市場が 現在の文脈で上方向に過度に伸びている可能性を示唆します。
これらの極端な読み値は必ずしもすぐに「買い」や「売り」を意味するわけではありませんが、市場が 特定の時間枠内で典型的な動きの範囲の極端なポイントにあることを強力に警告します。これはしばしば平均回帰や市場のボラティリティ挙動の変化の前兆となります。
概要
カスタマーレビュー
5 | 0 % | |
4 | 100 % | |
3 | 0 % | |
2 | 0 % | |
1 | 0 % |


