
説明
標準的なピボットポイントを計算するための公式は次のとおりです:
PP = (High + Low + Close)/3
S1 = (PP * 2) – High
S2 = PP – (High – Low)
S3 = Low – 2(High – PP)
R1 = (PP * 2) – Low
R2 = PP + (High – Low)
R3 = High + 2(PP – Low)
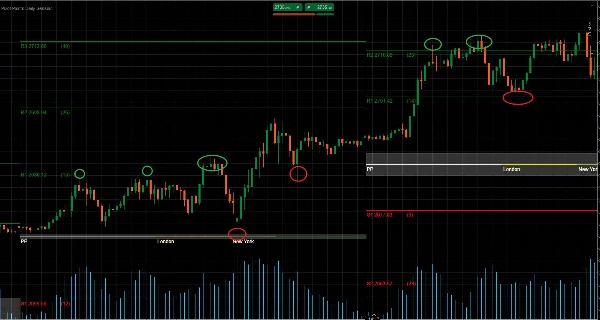
ピボットポイントは全体のトレンドを識別するために使用できます。ピボットポイントを上抜ける動きは上昇トレンドを示します。一方、価格が取引セッション中にピボットポイントを下回り続ける場合は下降トレンドを示しています。
レンジ相場では、トレーダーは単純に抵抗線で売り(ショート)を行い、支持線で買い(ロング)を行うことができます。例えば、市場がR1とS1の間にある場合、買い注文はS1付近に、売り注文はR1付近に配置されます。
トレンド相場では、関連するピボットポイントが調整局面の基準点として機能し、主要トレンドの再開を示します。例えば、上昇トレンド中に価格がPPを上回っているがR2を下回っている場合、トレーダーはR1付近に有利な買い注文を配置することができます。
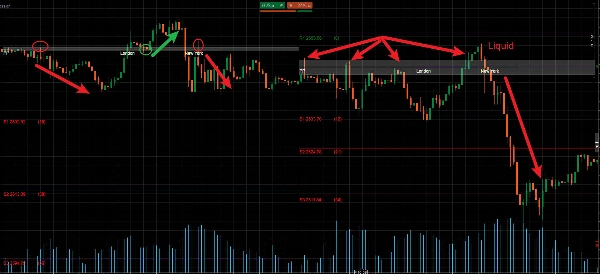
支持線と抵抗線は市場の一部で必ず破られます。これらのブレイクアウト期間は多くの取引機会を提供します。ピボットポイントは市場での潜在的な価格ブレイクアウトの取引にも使用できます。
価格のブレイクアウトは、価格が既存の支持線または抵抗線を突破し、その役割を効果的に切り替えるときに発生します。例えば、S2で下方ブレイクアウトが発生した場合、ピボットラインは支持線ではなく抵抗線と見なされます。
この場合、S2の下では売り注文のみが考慮され、他のピボットラインはストップロスと利益確定の設定を導きます。売り注文のストップロスはS2とS1の上に設定でき、利益目標はS3およびそれ以下に設定されます。
中文说明:
枢轴点可用于识别整体趋势,因为价格向上突破枢轴点表明上升趋势。与此同时,相反的情况,即价格在交易时段内持续跌破枢轴点,则表明下降趋势。
在区间震荡市场中,交易者可以简单地在阻力位做空(卖出)和在支撑位做多(买入)。例如,如果市场在R1和S1之间波动,买单将放置在S1附近,卖单放置在R1附近。
在趋势市场中,相关的枢轴点将作为回调市场恢复主要趋势的参考点。例如,如果在上升趋势中价格高于PP但低于R2,交易者可以考虑在R1附近设置有利可图的买单。
支撑位和阻力位在某些市场情况下必然会被突破。这些突破期可以在市场中提供许多交易机会。枢轴点也可用于交易市场中潜在的价格突破。
价格突破发生在价格冲破现有的支撑位或阻力位并有效转换其角色时。例如,如果在S2处发生向下突破,该枢轴线将不再是支撑线,而将被视为阻力线。
在这种情况下,只有在S2下方才会考虑卖单,其他枢轴线可以指导止损和止盈的设置。卖单的止损可以设在S2和S1上方,盈利目标设在S3及以下。
概要
カスタマーレビュー
5 | 100 % | |
4 | 0 % | |
3 | 0 % | |
2 | 0 % | |
1 | 0 % |


