説明
📈 DEnvelopSystem — デュアルタイムフレームエンベロープ精度
DEnvelopSystem は、スキャルパーやデイトレーダー向けに設計された高性能トレーディングインジケーターで、精度、適応性、そして収束を求める方に最適です。シームレスに動作するよう設計されており、1〜5分のタイムフレームで、二つの移動平均エンベロープを二つの異なるタイムフレームから組み合わせ、トレンドフォローと平均回帰の両方の戦略に対応する動的なフレームワークを提供します。
🔧 主な特徴
- デュアルタイムフレームエンベロープ融合
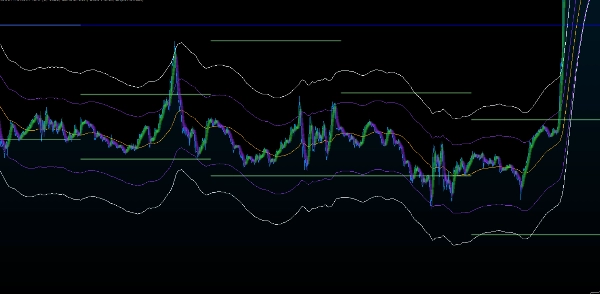
二つのタイムフレームのエンベロープを重ね合わせ、広範な構造的動きの中の短期的なボラティリティを捉えます。マクロトレンド内のマイクロプルバックを特定するのに理想的です。 - カスタムパーセンテージ価格偏差
調整可能なパーセンテージ閾値でエンベロープの感度を微調整でき、トレーダーが独自のボラティリティバンドやブレイクアウトゾーンを定義できます。 - 5ラインの視覚化
合計5本のラインを表示します:2本の上限、2本の下限、そして中央の移動平均 — 価格の動きと圧縮ゾーンの明確な視覚マップを作成します。 - 色分けされた収束ゾーン
カスタムカラーリングにより、重なりや発散の重要なエリアを強調表示し、高確率のエントリーゾーンを即座に認識可能にします。 - トレンド&リバージョンの相乗効果
モメンタムに乗る場合でも極端な値をフェードする場合でも、DEnvelopSystemはあなたの戦略に適応し、ブレイクアウトとバウンスの両方のセットアップに信頼できるシグナルを提供します
🎯 トレーダーが愛用する理由
- 基盤となる収束ツール:マルチインジケーターセットアップの視覚的なアンカーとして機能し、精度の高いエントリー確認を助けます。
- スキャルピング最適化:タイミングと明確さがすべての高速環境向けに構築されています。
- エントリーマスタリー:価格がタイムフレームを超えてエンベロープの境界と相互作用するゾーンを特定し、スナイパースタイルのエントリーとタイトなストップ配置に最適です。
概要
インジケーターのプロフィール
カスタマーレビュー
5.0
レビュー: 1
5 | 100 % | |
4 | 0 % | |
3 | 0 % | |
2 | 0 % | |
1 | 0 % |
ディスカッション
よくあるご質問
cTrader Storeで入手可能な取引ボット、インジケーター、プラグインなどの商品は、第三者の開発者が提供するものであり、情報と技術の取得のみを目的としてご利用いただけます。cTrader Storeはブローカーではなく、投資助言や個人的な推奨を行うことも、将来のパフォーマンスを保証することもありません。


これも好きかも


価格
25
販売
2.1K
無料インストール