
説明
▁▂▃▄▅▆▇ █ 10,000+ トレーダー(機関投資家+個人投資家) █ ▇▆▅▄▃▂▁
- cTraderで当社のTOPインジケーターを選択 🏆
- ✨ 優れた結果のための独占的な精度 ✨
- 📈 当社のアルゴリズム —最高評価のビジュアル🎯—
- 2つのクオンツファンドで成功裏に実装されています
▁▂▃▄▅▆▇ █████████████████████████████ ▇▆▅▄▃▂▁
_______________________________________________
_______________________________________________
📌 マーケット構造インジケーター
· ✅ AdvancedMarket Structure: Bos, Choch, SwinLevels, Order Blocks, Market Structure&流動性ファインダー
· 🔄 ダイナミックマーケット構造 ターニングポイントの分析
· 🧱 オーダーブロック
· ⚖️ マーケットアンバランス
· ⛓️ BOS&CHOCH
· 🧠 ICT Power of 3
· 🌀 マーケットポラリティゾーン
______________________________________________________________-
ストアcBots : 🧠 Gold&BTCブレイクアウトセッションピボット 🧠
_______________________________________________
🔚 スマートエグジットシステム
· 📍 トレーリングスマートアルゴリズム
_______________________________________________
📐 ジグザグインジケーター
· 🔍 ジグザグ価格流動性予測
· 🧭 S&R構造ジグザグ
· ➖ ジグザグ
· 🎯 ジグザグ極端トラッカー
_______________________________________________
🧱 サポート&レジスタンスインジケーター
_______________________________________________
📊 トレンド&チャネルインジケーター
· 🔄 オートトレンドチャネル
· 📊 スーパートレンド
· 🧠 アダプティブトレンドチャネル
· 💥 チャネルブレイクアウトシステム
· ⭐ プレミアムSSLチャネル
· 🔁 リアクティブ移動平均
_______________________________________________
💧 ボリューム&流動性ツール
· 🔥 ボリュームPOCヒートマップ
· 📉 レバレッジ清算マップ
· 🔍 モメンタムフェアバリューギャップ
· 🕒 フェアバリューギャップセッション
_______________________________________________
⚡ モメンタム&RSIインジケーター
· 📈 RSIトレンドトリガー
· 🚀 ダイナミックレンジモメンタム
_______________________________________________
🔮 予測&投影ツール
· 📐 Linreg&ATRに基づく予測
______________________________________________________________________________________________________
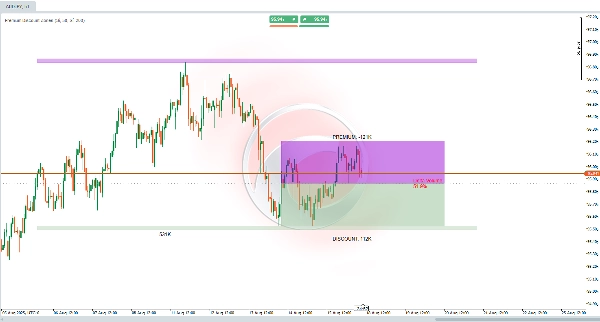
プレミアムディスカウントゾーンインジケーターは何をするのか? 🎯
このインジケーターは、重要なエリアを特定するのに役立つよう設計されています。最近の市場の高値と安値に基づき、設定可能な期間の過去のバーを分析して一般的な価格帯を決定し、中間均衡点を計算し、その範囲を2つの主要ゾーンに分割します:
- 🔺 プレミアム(上部ゾーン)
- 🟩 ディスカウント(下部ゾーン)
また、これらのバーの取引量を評価して、「ボリュームデルタ」を計算します。これは、弱気の動きに関連するボリュームの割合を示します。
何のために使うのか? 💡
このインジケーターは、価格が以下の可能性があるエリアを見つけるのに役立ちます:
- 📈 過大評価(プレミアムゾーン) → 売りや利益確定の可能性
- 📉 過小評価(ディスカウントゾーン) → 買いまたは蓄積の可能性
市場の不均衡を素早く把握でき、最近のボリュームが強気か弱気かを強調します。 拡張された構造ゾーンは、即時の範囲を超えた重要なレベルを示し、トレンドや反転の取引計画に役立ちます。🚀
統合レンジ、ブレイクアウト、機関投資家の取引、流動性分析をターゲットにした戦略に最適です!
どのように解釈するか? 🔍
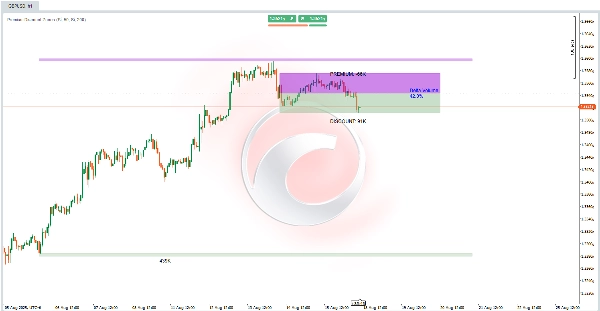
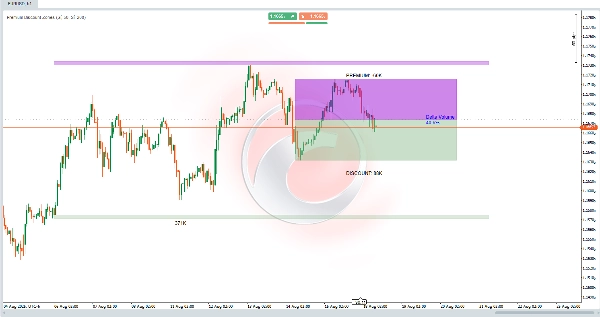
- 🟣 プレミアムゾーン(紫、均衡点上) → 価格が「高価」と見なされる上部範囲。
- 🟢 ディスカウントゾーン(緑、均衡点下) → 価格が「安価」と見なされる下部範囲。
- ⚖️ 均衡線(灰色、中間) → 範囲の中間点を示し、バランスレベルとして機能します。ここでの価格のクロスオーバーは、バイアスの変化を示す可能性があります。
- 📊 ボリュームデルタ(中央) → 弱気のボリューム%を示します(🔴 >50% = 弱気、🔵 <50% = 強気)。
- 🏛 構造ゾーン(シェード付き拡張) → 範囲の極端な上/下に拡張されたエリアで、最近の価格動向に基づくバッファを持つ長期的なサポート/レジスタンスとして機能します。
インジケーターはこれらのゾーンを最近のバーで動的に更新し、将来の投影のために右方向に拡張します。
取引での使い方は? 🛠️
- 初期設定:
-
- PDレベル(メイン)を有効にし、必要に応じて構造ゾーンも有効にします。
- 振り返り期間を調整:
-
- 短期(例:50バー)→ 最近のレンジ
- 長期(例:200バー)→ 構造的コンテキスト
- チャート分析(例:H1タイムフレーム):
-
- 価格が🟣 プレミアム(弱気の確認で売りを検討)または🟢 ディスカウント(強気の確認で買いを検討)にあるかを確認します。
- 確認のためにボリュームデルタを使用します:
-
- 🔴 >50% → プレミアムでショートを支持
- 🔵 <50% → ディスカウントでロングを支持
- エントリー&エグジット戦略:
-
- 🟢 ディスカウントゾーンで買い:価格が緑のゾーンに入り、デルタが低い場合、ロングエントリーを探し、ゾーンの安値の下にストップを置き、均衡点またはプレミアムを目標にします。
- 🟣 プレミアムゾーンで売り:価格が紫のゾーンに達し、デルタが高い場合、ショートを検討し、ゾーンの高値の上にストップを置き、均衡点またはディスカウントを目標にします。
- 🏛 構造ゾーンを使用して、長期取引にバッファを誤差範囲として適用します。
概要
The indicator also computes a Volume Delta, representing the percentage of volume associated with bearish movements, which helps confirm market bias: values above 50% favor bearish conditions, while values below 50% favor bullish conditions. Extended structural zones project key support and resistance levels beyond the immediate range, useful for planning trades in trending or reversal markets.
Users can adjust lookback periods to focus on recent ranges or broader structural context. The indicator dynamically updates these zones and extends them forward for future projections. It supports trading strategies involving consolidation ranges, breakouts, institutional trading, and liquidity analysis by providing visual cues on price valuation and volume-driven market imbalances.


