
说明
公允价值缺口指标
概述
公允价值缺口指标是一个为价格行为交易者设计的精确工具,旨在识别、跟踪和验证短期市场失衡。它自动检测看涨和看跌的公允价值缺口(FVG),在您的图表上突出显示活跃(未缓解)区域,并记录价格何时填补(缓解)这些区域。该指标轻量且不重绘(基于已闭合的K线操作),旨在为实盘交易和回测提供可靠的分析。
主要特征
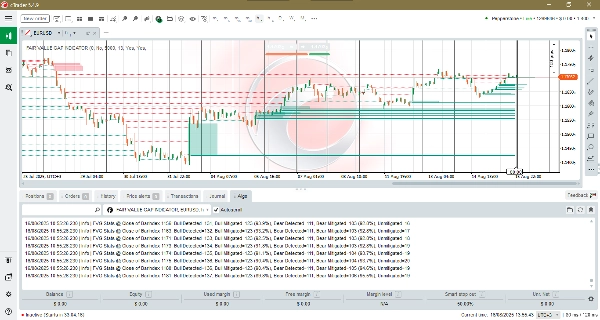
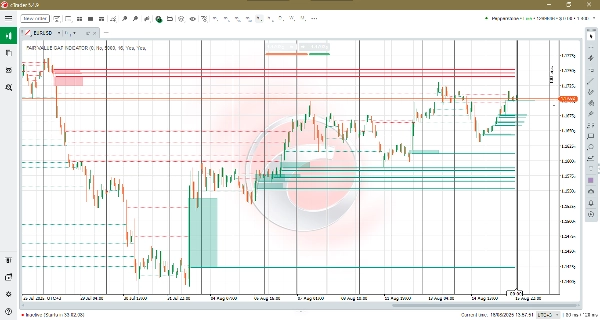
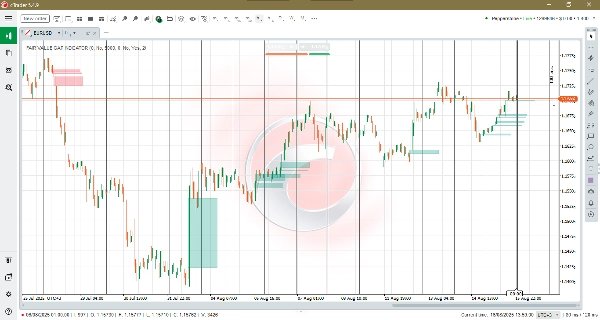
- 自动FVG检测: 强大的三根K线逻辑识别看涨和看跌失衡区域,并在图表上绘制清晰的矩形区域。
- 缓解跟踪: 当价格收盘穿过某一区域时,指标会移除该框,并可绘制持久的虚线缓解线以供历史参考。
- 未缓解水平叠加:显示最近N个未填补水平,作为粗体水平线从检测K线延伸到当前形成的K线。这样可以轻松直观地扫描活跃(未缓解)的公允价值缺口,并快速识别其价格水平。
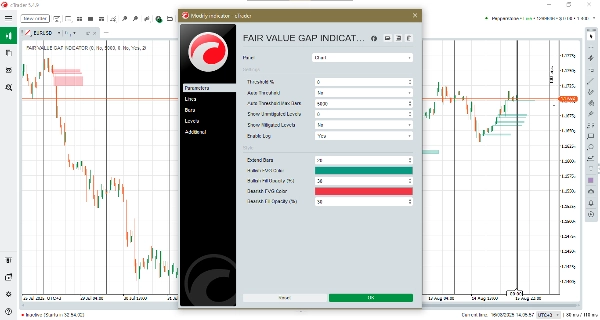
- 手动与自动阈值设定: 选择固定的相对阈值,或启用自动阈值,让指标适应近期市场活动。
- 自动阈值最大K线数: 控制用于计算自动阈值的滑动窗口大小。较大数值使阈值更平滑(在更长历史中稳定);较小数值使其对近期波动更敏感。
- 自定义视觉效果与投影: 设置延伸长度(盒子投影的距离)、颜色和看涨及看跌区域的填充不透明度,以匹配您的图表风格。
- 终端日志记录: 紧凑的日志行报告检测到的总FVG数量、缓解情况及当前未缓解计数——非常适合验证和策略调优。
- 闭合K线逻辑: 设计为每根闭合K线运行一次,以最小化重绘。
优势
- 清晰的交易参考: 快速找到可能作为回归目标、反应区域或交易管理参考的失衡区域。
- 验证与统计: 使用终端日志和缓解百分比验证信号,并调整策略的灵敏度。
- 适应性灵敏度: 自动阈值+最大K线数让指标在安静和波动市场中均表现可靠,无需频繁手动调整。
- 紧凑且不干扰的视觉效果: 最小的视觉占用保持图表清晰,同时保留必要的上下文。
适用对象
依赖价格行为和失衡概念的日内交易者、波段交易者和剥头皮交易者,以及验证订单流反应和策略表现的分析师。
结论
公允价值缺口指标结合了精确的失衡检测、缓解分析和自适应阈值,为您提供专注且低噪声的市场失衡视图。使用它来发现潜在的价格回归,更智能地管理交易,并衡量市场中区域被填补的频率。
摘要
AI 摘要
The Fair Value Gap (FVG) Indicator is a technical analysis tool designed for price-action traders to identify and monitor short-term market imbalances. It automatically detects bullish and bearish Fair Value Gaps using a robust 3-bar logic and visually highlights active (unmitigated) zones on trading charts. The indicator tracks when these zones are later filled (mitigated) by price action, removing the zone highlight and optionally drawing a persistent dotted line for historical reference.
Key features include automated FVG detection, mitigation tracking, and an overlay showing recent unmitigated levels as bold horizontal lines for easy visual scanning. Users can select manual or automatic thresholding to adapt sensitivity to market conditions, with adjustable parameters controlling the responsiveness of the auto threshold. Customizable visual settings allow traders to tailor the appearance of bullish and bearish zones.
The indicator operates on closed bars to minimize repainting, ensuring reliable signals for live trading and backtesting. Terminal logging provides concise statistics on detected gaps and mitigations, aiding validation and strategy tuning.
Suitable for day traders, swing traders, scalpers, and analysts, the Fair Value Gap Indicator supports markets including Forex, indices, commodities, cryptocurrencies, and stocks. It offers a focused, low-noise view of market imbalances to assist in identifying potential price return targets and managing trades.
指标配置
客户评价
5.0
评价:2
5 | 100 % | |
4 | 0 % | |
3 | 0 % | |
2 | 0 % | |
1 | 0 % |
客户评价
讨论
常见问答
Forex
Indices
Commodities
Fair Value Gap
SMC
Crypto
Stocks
cTrader Store 提供的所有产品,包括交易机器人、指标和插件,均由第三方开发者提供,仅供信息参考和技术访问之用。cTrader Store 并非经纪商,不提供投资建议、个人推荐或任何未来业绩保证。


价格
注册日期 14/06/2025
1
销售