
Volume Profile Suite v1.1
指标
6 购买
版本 1.0, Oct 2025
Windows 版、Mac 版
4.5
评价:2
说明
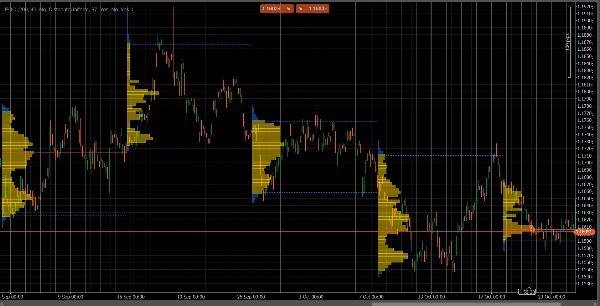
VolumeProfileSuite 是 cTrader 的一个先进且灵活的成交量剖面指标。
它的主要目的是分析成交量分布(即,交易活动发生的不同价格水平),以识别“价值区”(高成交量)和“拒绝区”(低成交量)。这有助于您根据真实的市场活动找到最重要的支撑和阻力位。
它的独特之处在于将两种强大的分析模式合并为一个工具,可通过Profile Mode参数选择:
FixedRange模式:非常适合宏观分析。它允许您分析您选择的单个大型区块(如最近1000根K线或特定日期范围,例如“上周全部”)。非常适合寻找主要的长期支撑/阻力位。Periodic模式:非常适合微观和行为分析。它会自动每“N”根K线绘制一个新的剖面(例如每100根K线)。这让您可以观察POC和价值区随时间的演变,研究市场的重复模式。- 参数指南(英文)
这是您新的统一版VolumeProfileSuite指标的更新指南。该指南非常重要,因为它解释了根据您选择的模式应使用哪些参数(以及忽略哪些参数)。
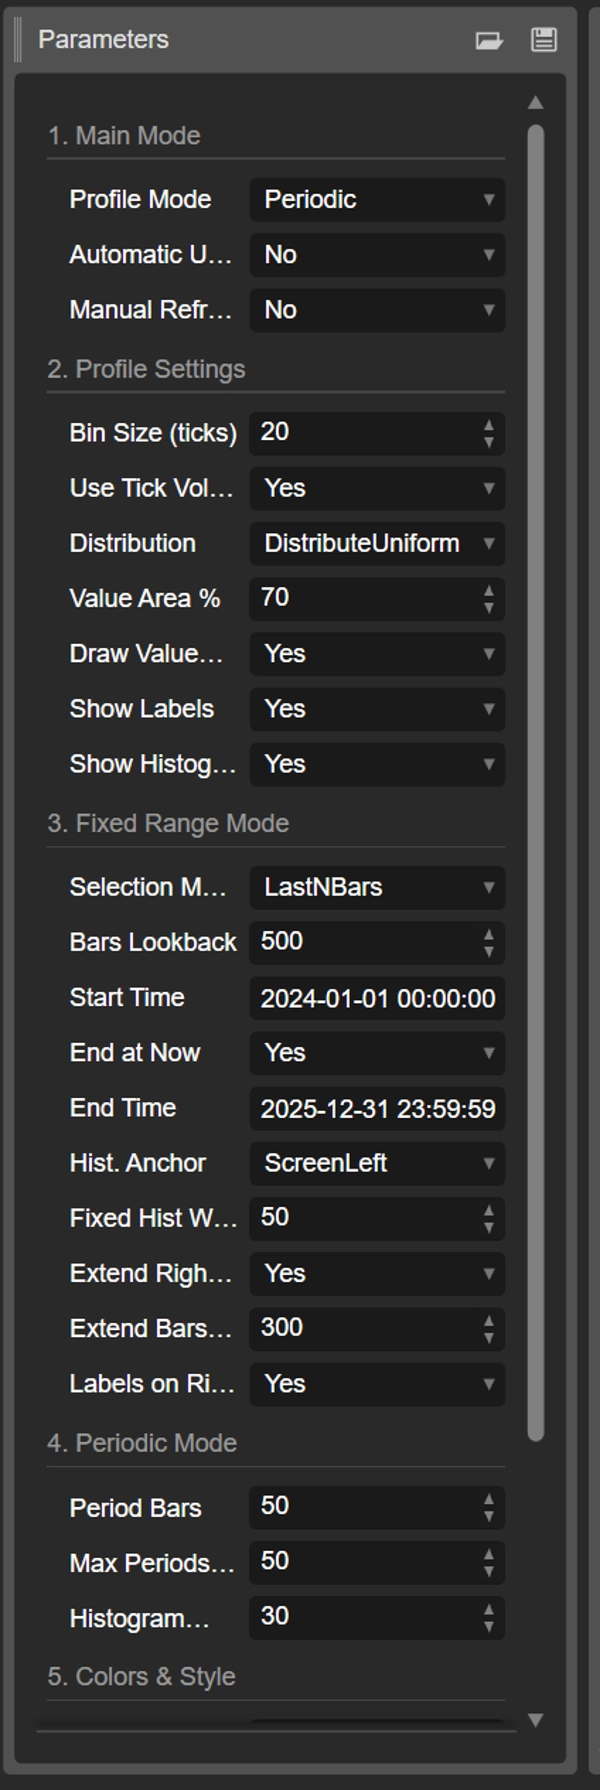
第1组:主模式
- Profile Mode:这是最重要的参数,作为主开关。
-
FixedRange:激活“单区块”模式。指标将仅分析您指定的一个区间(使用第3组的设置)。Periodic:激活“周期”模式。指标将自动按区块分析整个图表(基于第4组的设置)。
重要:当处于
FixedRange模式时,您必须忽略“第4组:周期模式”中的所有参数。当处于Periodic模式时,您必须忽略“第3组:固定区间模式”中的所有参数。
第2组:剖面设置
这些参数是通用的,适用于两种模式(FixedRange和Periodic)。
- Bin Size(ticks):控制剖面的垂直“分辨率”。较低的值(例如
1)会创建许多细小的价格行(非常详细)。较高的值(例如10)将价格分组为较粗的行(不那么详细,更“平滑”)。 - 使用Tick成交量:如果
true(推荐),剖面使用真实的tick成交量,非常准确。如果false,则每根K线计数为“1”。 - 分布方式:定义K线成交量的分布方式。
-
DistributeUniform(默认):将K线成交量“均匀分布”到其触及的所有价格水平,从最低价到最高价。CloseOnly:将所有成交量仅分配给收盘价。
- 价值区百分比:设置构成“价值区”(最高交易活动区域)的成交量百分比。70%
70是市场标准。 - 绘制价值区(VAH/VAL):如果
true,绘制价值区高点(VAH)和价值区低点(VAL)的水平线。 - 显示标签:如果
true,显示文本标签(“POC”,“VAH”,“VAL”)。(注意:在Periodic模式下,可能会使图表显得杂乱)。 - 显示直方图:如果
true,绘制成交量直方图(水平条)。
第3组:固定区间模式
⚠️ 仅当“Profile Mode”设置为FixedRange时使用这些参数。
- 选择模式:选择如何定义您的单一区块。
-
DateRange:使用特定的开始和结束日期/时间。LastNBars:使用最近的N根K线。
- 回溯K线数:(仅针对
LastNBars)分析多少根K线(例如500)。 - 开始时间 / 结束于当前 / 结束时间:(仅针对
DateRange)定义区间的开始和结束。 - 直方图锚点:(仅针对
FixedRange)定义直方图的锚定位置。 -
DateRangeStart:在区间开始处(可能在屏幕外)。ScreenLeft:在可见窗口的左边缘。ScreenRight:在可见窗口的右边缘(空白区域)。
- 固定直方图宽度(K线数):固定区间模式下直方图的宽度(以K线数计)。
- 仅向右延伸:如果
true,POC/VAH/VAL线将向未来延伸。 - 延伸K线数:(仅当
仅向右延伸为true时)延伸线的K线数量。 - 右侧标签:如果
true,在延伸线的右端放置价格标签。
第4组:周期模式
⚠️ 仅当“Profile Mode”设置为Periodic时使用这些参数。
- 周期K线数:这是该模式的关键参数。定义每个周期区块包含多少根K线(例如
100)。 - 最大绘制周期数:🌟 安全参数!限制绘制的周期剖面数量,以防止cTrader崩溃。设置为
50表示即使历史数据更多,也只绘制最近50个剖面。请勿设置过高(例如>200),否则cTrader可能会冻结! - 直方图宽度(K线数):每个周期区块的直方图宽度(以K线数计)。
第5组:颜色与样式
这些参数是通用的,适用于两种模式。
- POC颜色:控制控制点线的颜色。
- VA颜色:控制VAH和VAL线的颜色。
- 线条粗细:控制POC、VAH和VAL线的粗细。
- 价值区直方图颜色:价值区内直方图条的颜色(默认:黄色)。
- 价值区外直方图颜色:价值区外直方图条的颜色(默认:蓝色)。
- 直方图透明度百分比:整个直方图的透明度(不透明度)。
摘要
AI 摘要
VolumeProfileSuite is an advanced Volume Profile indicator designed for the cTrader platform. It analyzes volume distribution across price levels to identify key areas of high trading activity ("value") and low activity ("rejection"), helping to pinpoint significant support and resistance zones based on actual market volume.
The indicator offers two main analysis modes selectable via the Profile Mode parameter:
1. FixedRange Mode: Analyzes a single user-defined interval, such as a specific date range or the last N bars, suitable for macro-level, long-term support and resistance identification.
2. Periodic Mode: Automatically segments the chart into consecutive blocks of N bars, drawing a new profile for each. This mode supports micro-level and behavioral analysis by tracking how the Point of Control (POC) and Value Area evolve over time.
Common configurable settings include bin size (price resolution), volume type (tick volume or bar count), volume distribution method, value area percentage, and visual options such as histogram display and labeling. FixedRange and Periodic modes have distinct parameter groups to tailor their respective analyses.
Color and style options allow customization of POC, Value Area lines, and histogram appearance. The tool supports various markets including Forex, indices, commodities, stocks, and cryptocurrencies, as indicated by its relevant tags.
指标配置
客户评价
4.5
评价:2
5 | 50 % | |
4 | 50 % | |
3 | 0 % | |
2 | 0 % | |
1 | 0 % |
客户评价
November 11, 2025
The signal still needs a chart check, no surprise there. 2 sessions is the line to watch.
讨论
常见问答
Signal
Indices
Commodities
GBPUSD
RSI
Bollinger
Fibonacci
Scalping
AI
XAUUSD
NAS100
MACD
BTCUSD
Forex
Breakout
EURUSD
NZDUSD
Martingale
Prop
ZigZag
Supertrend
Fair Value Gap
SMC
Crypto
Grid
Stocks
ATR
USDJPY
VWAP
cTrader Store 提供的所有产品,包括交易机器人、指标和插件,均由第三方开发者提供,仅供信息参考和技术访问之用。cTrader Store 并非经纪商,不提供投资建议、个人推荐或任何未来业绩保证。


价格
42.11M
交易量
6.13M
盈利点数
213
销售
8.22K
免费安装