
Price Change Bundle 1.0 BT
Gösterge
2 satın almalar
Sürüm 1.0, Aug 2025
Windows, Mac
4.0
Değerlendirmeler: 1
Açıklama
Fiyat Değişikliği Paketi — 3 gösterge, 1 mantık.
Kendi kurulumumdan araçlar (Arz & Talep + özel ZigZag). Fiyatın gerçekten nasıl hareket ettiğini yüksek zaman dilimi kapanışları etrafında göstermek için oluşturuldu.
Her modülü açıp kapatın — Seviyeleri, Çubukları, Histogramı ayrı ayrı etkinleştirin/devre dışı bırakın.
Modüller
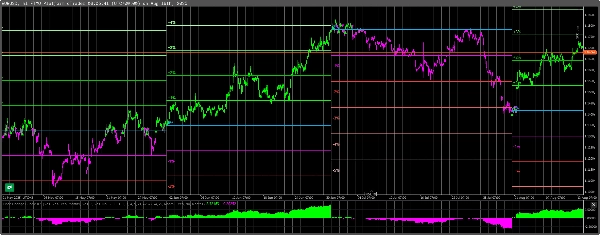
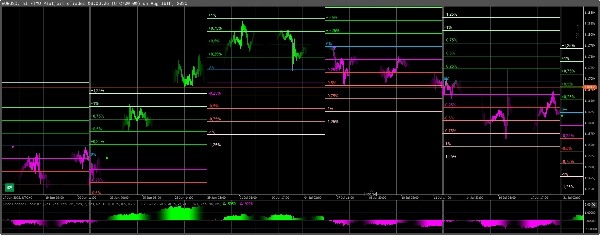
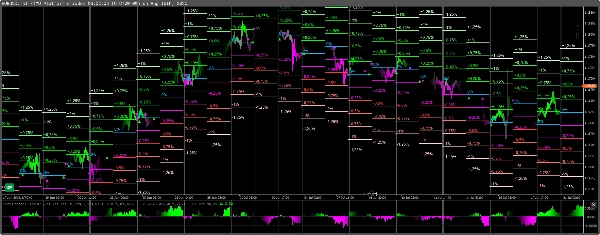
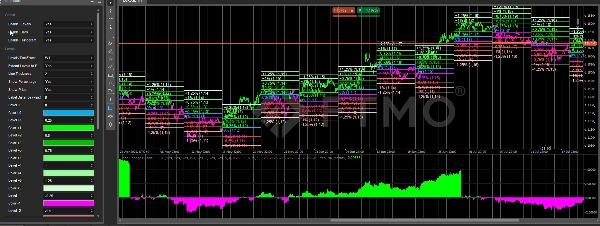
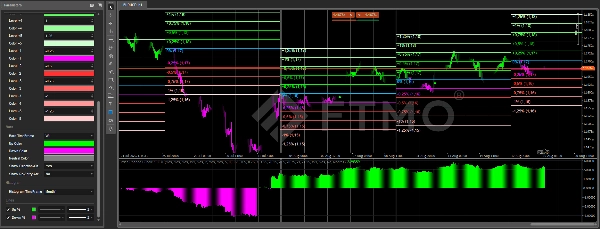
Fiyat Değişikliği Seviyeleri
- Seçilen zaman diliminde yüzde bölgeleri (±0.25…±1.25%) çizer.
- Her bölge %0 baz çizgisinden ölçülür ve yüzde ve fiyat gösterir.
- Temiz haftalık/aylık haritalar için çizgileri dönemin sonuna uzatma seçeneği.
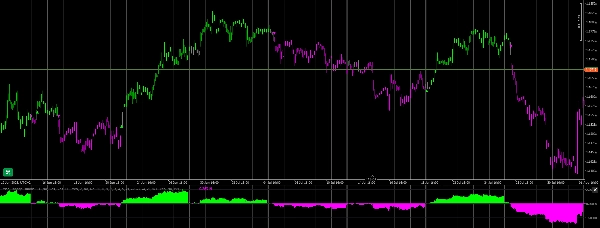
Fiyat Değişikliği Çubukları
- Mumları Tam Üstünde/Altında rejimine göre TF pivotuna karşı renklendirir.
- Girişler ve rejimin hızlı okunması için en iyi bar kapanışında kullanılır.
- İçerir Yön Değişikliği & Tekrar Giriş okları (nötr → aynı taraf sonrası).
Fiyat Değişikliği Histogramı
- Aynı TF referansına karşı genel yüzde gelişimini gösterir (Yukarı% / Aşağı%).
- Hızlanma/yavaşlamaları anında fark etmek için mükemmeldir.
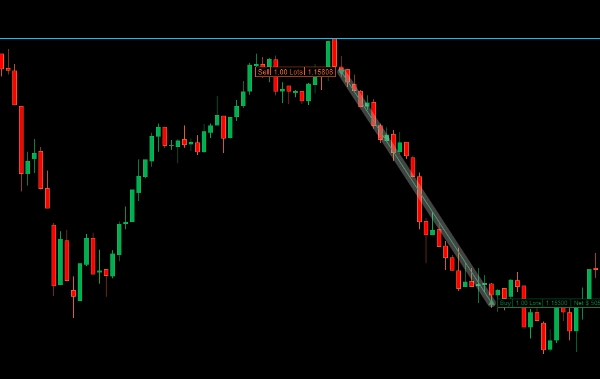
Neden işe yarar — “Fiyat Hareketinin Sırları”
- Uzmanlar, yüksek TF'lerin (AY/HAFTA/GÜN) önceki kapanışlarına tutunur.
- Bu ankere göre ölçülen % mesafeler pratik mıknatıslar/hedefler gibi davranır.
- Bir mum tamamen pivotun üstünde/altında ise rejimi tanımlar; nötr sonrası tekrar giriş genellikle hareketi devam ettirir.
Esnek kullanım
- Her modül için istediğiniz zaman dilimini seçin (örneğin, AY Seviyeleri • HAFTA Çubukları • GÜN Histogramı).
- Herhangi bir grafik türünde çalışır, dahil Renko/aralık/tick (hesaplamalar seçtiğiniz zaman bazlı TF'leri kullanır).
- Yeniden boyama yok. Hafif.
Video & Destek
- Bir adım adım video (kurulum, ön ayarlar, ticaret örnekleri) yakında yayınlanacak.
- Alıcılar doğrudan benimle iletişime geçebilir her türlü soru, kurulum yardımı veya geri bildirim için. Kişisel olarak yanıt veririm.
Özet
YZ özeti
Price Change Bundle 1.0 BT is a composite indicator consisting of three modules—Levels, Bars, and Histogram—designed to analyze price movements relative to higher timeframe closes. It integrates concepts from Supply & Demand and a custom ZigZag to reveal how price behaves around significant reference points.
- Price Change Levels: Displays percentage zones (±0.25% to ±1.25%) from a 0% baseline within a selected timeframe, showing both percentage and price values. Lines can be extended to the period’s end for clear weekly or monthly mapping.
- Price Change Bars: Colors candles based on their position relative to the timeframe pivot, indicating regimes with full above/below coloring. Includes arrows signaling direction changes and re-entries after neutral phases, aiding entry decisions.
- Price Change Histogram: Illustrates overall percentage development (Up%/Down%) against the same timeframe reference, facilitating quick identification of acceleration or slowdowns.
Each module can be toggled on or off independently and configured with different timeframes. The indicator works on any chart type, including Renko, range, and tick charts, using time-based timeframe calculations. It anchors calculations to previous closes of higher timeframes (monthly, weekly, daily) and does not repaint. Buyers have access to direct support from the developer.
Gösterge profili
Müşteri değerlendirmeleri
4.0
Değerlendirmeler: 1
5 | 0 % | |
4 | 100 % | |
3 | 0 % | |
2 | 0 % | |
1 | 0 % |
Müşteri değerlendirmeleri
February 9, 2026
Price Change Bundle 1.0 BT delivers clear and practical price-change metrics. Best used on M10-H1, where momentum readings stay balanced and meaningful. Great for filtering weak moves, confirming impulse strength and improving intraday timing. A simple but effective companion for momentum-based strategies.
Tartışma
SSS
Prop
Forex
Signal
Breakout
Indices
cTrader Store üzerinden erişilebilen işlem botları, göstergeler ve eklentiler gibi ürünler, üçüncü taraf sağlayıcılar tarafından sağlanır ve yalnızca bilgilendirme ve teknik erişim amaçlarıyla sunulur. cTrader Store bir broker değildir ve yatırım tavsiyesi, kişisel öneriler vermez veya gelecekteki performansı garanti etmez.


Fiyat
48
Satışlar
1.07K
Ücretsiz yüklemeler