Opis
Camarilla by Bullitt Traders — Wizualizuj Strukturę. Handluj Precyzyjnie.
Profesjonalny wskaźnik pivot Camarilla dla cTrader, stworzony, aby pokazać, jak cena reaguje wokół poziomów instytucjonalnych.
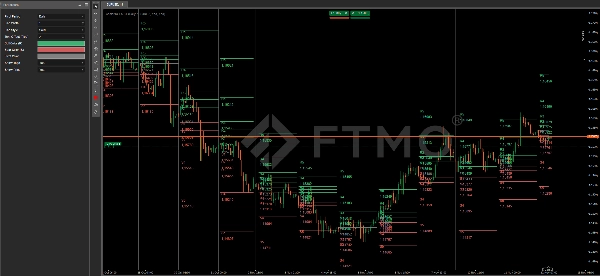
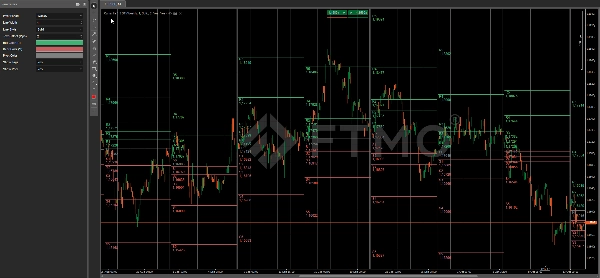
Automatycznie rysuje wszystkie kluczowe poziomy Camarilla (R1–R5 / S1–S5) oraz punkty pivot na wielu interwałach czasowych — dając traderom wyraźną mapę strukturalną dla odwróceń i wybicia.
Główne Funkcje
- ✅ Prawdziwa Formuła Camarilla — oblicza poziomy na podstawie maksimum, minimum i zamknięcia z poprzedniego okresu.
- 📊 Logika Multi-TF — wybierz pomiędzy dziennym, tygodniowym lub miesięcznym okresem pivot.
- 🕒 Mapowanie Historyczne — automatycznie rysuje minione okresy dla wizualnego kontekstu i analizy struktury.
- 🎨 Własne Style — dostosuj szerokość linii, styl i kolor dla każdego trybu (byczy, niedźwiedzi, neutralny).
- 💬 Etykiety i Ceny — przełącz wyświetlanie tekstu i wartości dla czystego lub szczegółowego układu.
- ⚡ Lekki i Nieprzerysowujący — zoptymalizowany pod kątem szybkości i dokładności dla każdego symbolu.
- 🧩 Działa na Wszystkich Typach Wykresów — kompatybilny z czasowymi, zakresowymi, tickowymi i Renko.
Poziomy Camarilla
R5 – Ekstremalna strefa celu wybicia
R4 – Główna opór, potencjalny wyzwalacz wybicia
R3 – Górna strefa odwrócenia, często używana do wejść na krótką pozycję
R2 – Opór na średnim poziomie
R1 – Początkowy opór, wczesny poziom reakcji
PP – Centralny punkt pivot (strefa średniorewersji)
S1 – Początkowe wsparcie, wczesny poziom reakcji
S2 – Wsparcie na średnim poziomie
S3 – Dolna strefa odwrócenia, często używana do wejść na długą pozycję
S4 – Główne wsparcie, potencjalny wyzwalacz wybicia
S5 – Ekstremalna strefa celu wybicia
Parametry
Okres Pivot – wybierz Dzienny, Tygodniowy lub Miesięczny do obliczania poziomów
Szerokość Linii – dostosuj ogólną grubość linii
Styl Linii – ustaw Solid, Kropki lub Kreski
Przesunięcie Tekstu (Pipsy) – odległość między linią a etykietą
Kolor Byczy (R) – kolor dla poziomów oporu (R1–R5)
Kolor Niedźwiedzi (S) – kolor dla poziomów wsparcia (S1–S5)
Kolor Pivot – kolor dla centralnej linii pivot (PP)
Pokaż Etykiety – pokaż lub ukryj nazwy poziomów R/S
Pokaż Cenę – pokaż lub ukryj numeryczne etykiety cen
Jak Używać
Strefy R3–S3 → typowe obszary odwrócenia intraday
Poziomy R4–S4 → potwierdzenia wybicia lub kontynuacji
R5–S5 → cele wysokiej zmienności i strefy wyczerpania
Podsumowanie
Key features include automatic plotting of historical pivot levels for context, customizable line width, style, and colors for bullish, bearish, and neutral regimes, and options to show or hide level labels and price values. The indicator is lightweight, non-repainting, and compatible with various chart types such as time, range, tick, and Renko charts.
Camarilla levels serve specific roles: R3–S3 zones indicate typical intraday reversal areas; R4–S4 levels suggest breakout or continuation confirmations; and R5–S5 mark extreme breakout targets and high-volatility exhaustion zones. This tool provides a clear structural map to assist traders in identifying potential reversals, breakouts, and target zones across multiple markets including Forex, indices, commodities, cryptocurrencies, and stocks.
Opinie klientów
5 | 100 % | |
4 | 0 % | |
3 | 0 % | |
2 | 0 % | |
1 | 0 % |