Q Trading Sessions
Wskaźnik
333 pobrania
Wersja 2.0, Mar 2026
Windows, Mac
5.0
Opinie: 3
Opis
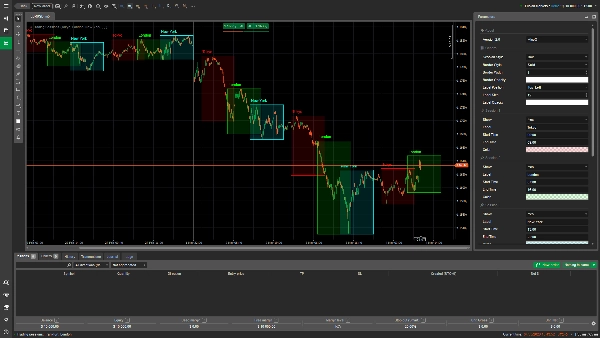
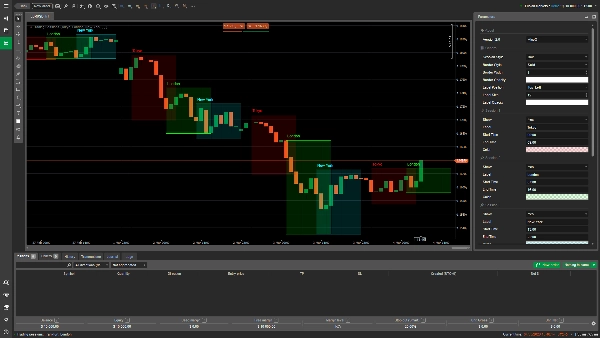
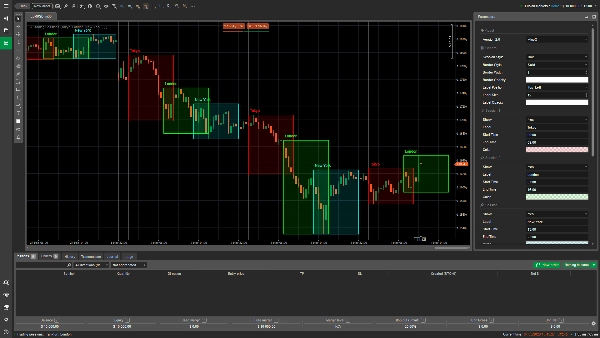
Q Trading Sessions to wizualny wskaźnik zaprojektowany, aby pomóc traderom w identyfikacji i śledzeniu aktywności rynkowej w różnych sesjach handlowych.
✨ Funkcje:
- Do 6 konfigurowalnych sesji handlowych.
- Własne czasy rozpoczęcia i zakończenia.
- Opcjonalne etykiety sesji.
- Indywidualne ustawienia kolorów dla każdej sesji.
- Lekki i nieinwazyjny.
---
AlgoQ
Jasność • Prostota • Stabilność
Podsumowanie
Podsumowanie AI
Q Trading Sessions is a visual indicator designed to assist traders in identifying and tracking market activity across multiple trading sessions. It supports up to six configurable sessions, each with customizable start and end times. Users can assign optional labels and set individual colors for each session to enhance clarity. The indicator is lightweight and designed to be non-intrusive, making it suitable for various markets including Forex, indices, commodities, stocks, and cryptocurrencies. It helps traders visually segment trading periods on their charts, facilitating better analysis of market behavior during different global trading hours.
Profil wskaźnika
Opinie klientów
5.0
Opinie: 3
5 | 100 % | |
4 | 0 % | |
3 | 0 % | |
2 | 0 % | |
1 | 0 % |
Opinie klientów
March 10, 2026
Q Trading Sessions is a clean and lightweight session visualization tool for cTrader. It allows traders to highlight up to six custom trading sessions directly on the chart with adjustable colors and optional labels. Perfect for intraday traders who want to track market activity during Asia, London, and New York sessions. Simple, efficient, and easy to configure.
February 22, 2026
QTS is really smooth on the chart and doesn't lag, though it is visible on +15 days.
February 22, 2026
Dyskusja
Częste pytania
BTCUSD
Forex
Indices
EURUSD
Commodities
GBPUSD
NZDUSD
Prop
Crypto
Stocks
XAUUSD
NAS100
USDJPY
Produkty dostępne za pośrednictwem cTrader Store, w tym boty handlowe, wskaźniki i wtyczki, dostarczane są przez deweloperów zewnętrznych i udostępniane wyłącznie w celach informacyjnych oraz w celu zapewnienia dostępu technicznego. cTrader Store nie jest brokerem i nie zapewnia doradztwa inwestycyjnego, nie udziela spersonalizowanych rekomendacji ani nie gwarantuje przyszłych wyników.


Cena
333
Bezpłatne instalacje