
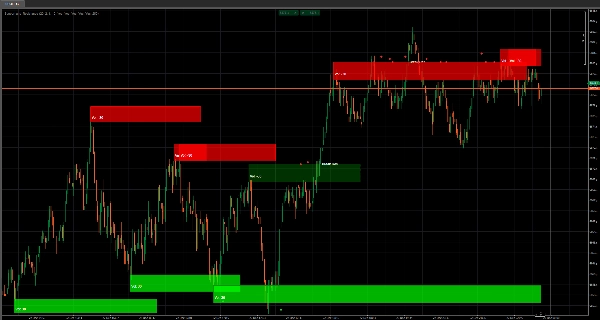
✅ Pudełka wsparcia i oporu o dużym wolumenie — automatycznie mapuje prawdziwe strefy „obrony / przebicia”
✅ Siła strefy ważona wolumenem (dynamiczna przezroczystość) — większy wolumen = silniejsza obecność pudełka
✅ Tworzenie stref na podstawie pivotów (okres wstecz) — tylko potwierdzone poziomy stają się strefami (mniej szumu)
✅ Adaptacyjna szerokość pudełka (oparta na ATR) — strefy skalują się do aktualnej zmienności, nie są stałymi przypuszczeniami
✅ Rozszerzenie pudełka na żywo — strefy ciągle się przedłużają w miarę rozwoju ceny
✅ Inteligencja przebicia / utrzymania — wykrywa, kiedy strefa się utrzymuje lub przebija i natychmiast reaguje
✅ Wizualne oznaczenia zdarzeń (diamenty) — czyste potwierdzenia „utrzymania / odwrócenia” bez zbędnego analizowania
✅ Etykiety przebicia — wyraźne zdarzenia „Przebicie wsparcia / przebicie oporu” na wykresie
✅ Pełna kontrola wizualna — przełączniki dla pudełek / tekstu wolumenu / diamentów / etykiet przebicia
✅ System automatycznego czyszczenia — zapobiega zaśmiecaniu wykresu przez automatyczne usuwanie starych oznaczeń zdarzeń
✅ Kontrola maksymalnej liczby pudełek — twardy limit dla utrzymania szybkości działania i czytelności wykresów
Wsparcie i opór (pudełka o dużym wolumenie) to nie jest podstawowe narzędzie S/R, które generuje losowe linie.
Ten wskaźnik został stworzony, aby pokazać Ci coś znacznie cenniejszego:
Gdzie cena stworzyła prawdziwe zainteresowanie — i gdzie najprawdopodobniej zareaguje ponownie.
Zamiast rysować „ładne poziomy”, buduje strefy podaży i popytu o dużym wolumenie jako pudełka bezpośrednio na Twoim wykresie, dzięki czemu możesz handlować strukturą jak profesjonalista:
zidentyfikuj strefę → obserwuj reakcję → handluj utrzymanie lub przebicie.
Główna zaleta: wolumen + struktura, a nie zgadywanie
Każde pudełko tworzone jest tylko wtedy, gdy spełnione są dwa warunki:
- Potwierdzony pivot (struktura ma znaczenie)
- Ekstremum wolumenu (zainteresowanie ma znaczenie)
To oznacza, że nie jesteś zasypywany słabymi strefami.
Masz mniej stref — ale te, które masz, to strefy naprawdę istotne.
Siła, którą możesz zobaczyć (przezroczystość = moc)
Tu robi się nieuczciwie dla osób handlujących „na ślepo” S/R.
Przezroczystość wypełnienia pudełka skaluje się z wolumenem, więc od razu wiesz:
- Słabe pudełko = lekkie zainteresowanie (obserwuj je)
- Silne pudełko = duże zainteresowanie (szanuj je)
Bez dodatkowych wskaźników, bez gimnastyki interpretacyjnej — jest to dosłownie widoczne.
Strefy adaptujące się do zmienności (szerokość ATR)
Rynki nie poruszają się tak samo każdego dnia.
Ten wskaźnik dostosowuje grubość pudełka, używając długoterminowej linii bazowej ATR, więc strefy rozszerzają się lub zwężają wraz ze zmiennością.
Efekt:
strefy pozostają realistyczne zamiast być zbyt cienkie, by miały znaczenie, lub tak szerokie, że są bezużyteczne.
Inteligencja utrzymania vs przebicia (i natychmiastowa wizualna informacja zwrotna)
Strefa jest wartościowa tylko wtedy, gdy możesz odczytać, co cena z nią robi.
Ten wskaźnik śledzi:
- Utrzymania (odrzucenie / szacunek)
- Przebicia (akceptacja przez strefę)
…a następnie aktualizuje styl na żywo:
- Utrzymania zachowują oryginalną „tożsamość wsparcia/oporu”
- Przebicia zmieniają zachowanie (wsparcie może stać się oporem i odwrotnie)
- Styl przebicia może zmienić się na przerywany + nowy odcień koloru, abyś od razu wiedział:
„Ten poziom właśnie zmienił charakter.”
Diamenty + etykiety przebicia: czyste wyzwalacze decyzji
Otrzymujesz proste, wysokosygnałowe markery zdarzeń:
- Diamenty do podkreślenia zdarzeń utrzymania/odwrócenia
- Etykiety przebicia aby nigdy nie przegapić momentu, gdy poziom pęka
To różnica między myśleniem, że coś się przebiło… a wiedzą, że się przebiło.
Stworzony do prawdziwego handlu: kontrola + czyste wykresy
Ten wskaźnik został zaprojektowany tak, aby pozostać użytecznym po wielu godzinach handlu:
- Chcesz tylko stref? Wyłącz diamenty/etykiety.
- Chcesz czyste sygnały? Wyłącz tekst wolumenu.
- Chcesz wydajność? Ogranicz Maksymalną liczbę pudełek.
- Nie lubisz bałaganu? Automatyczne czyszczenie zdarzeń utrzymuje wykres w porządku, usuwając stare oznaczenia automatycznie.
Skupiasz się na bieżącej walce — nie toniesz w historii.
Zalecane ustawienia (szybki start)
✅ Okres wstecz (Lookback Period): 20 (zrównoważone potwierdzenie)
✅ Długość filtra wolumenu (Vol Filter Length): 2 (reaktywny)
✅ Mnożnik szerokości pudełka (Box Width Mult): 1.0 (neutralny)
✅ Pokaż pudełka (Show Boxes): WŁ.
✅ Diamenty + etykiety przebicia (Diamonds + Break Labels): WŁ. (dopóki nie poznasz zachowania, potem dopracuj)
✅ Automatyczne czyszczenie zdarzeń (Auto-Clean Events): WŁ. (utrzymuj porządek)
Co naprawdę daje ten wskaźnik
Wizualną mapę gdzie rynek pokazał swoje karty — oraz na żywo odczyt, czy cena szanuje tę strefę, czy ją niszczy.
Jeśli handlujesz wybicia, cofnięcia, odwrócenia lub testy ponowne:
to staje się twoją „nakładką pola bitwy”.


![Logo „[Hamster-Coder] Bollinger Bands”](https://cdn.ctrader.com/image/webp/21d8e5d6-fb11-4bac-b9ee-cd05c2b76804_30327)


![Logo „Gaussian Channel [Iridio Capital]”](https://cdn.ctrader.com/image/webp/7c039209-5573-4a54-a072-f9528b503103_41960)


![Logo „[CB] Pivot Points Pro”](https://cdn.ctrader.com/image/webp/43463c82-67b0-4f10-a4ba-901bba091d81_32594)


