
Deskripsi
TSPivotSMC-V2: Perpaduan Pivot Klasik & Likuiditas Institusional
TSPivotSMC-V2 bukan sekadar indikator pivot point biasa; ini adalah peta Smart Money Concepts (SMC) canggih yang dirancang untuk trader yang menginginkan presisi institusional. Kami telah mengubah alat paling terpercaya dari analisis teknikal klasik menjadi mesin deteksi likuiditas dan zona probabilitas tinggi.
Fitur Utama:
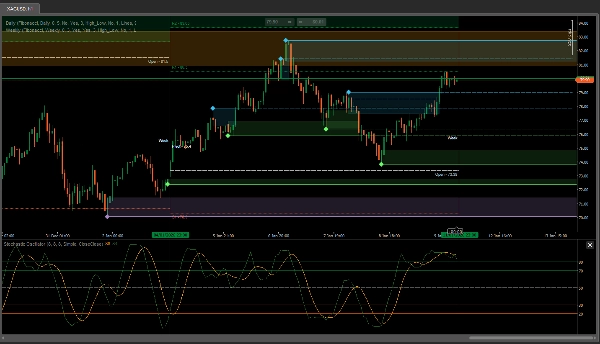
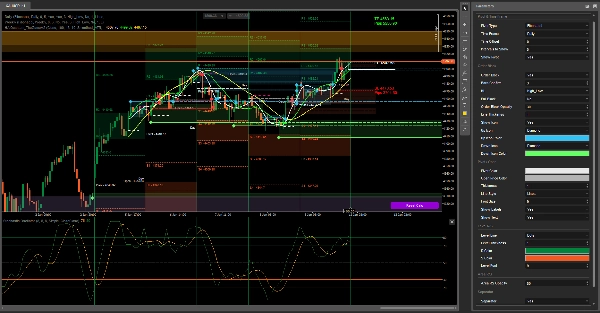
• Blok Order Sesi Otomatis: Mengidentifikasi dan menggambar persegi panjang pada level tertinggi dan terendah sesi sebelumnya, menandai zona pasokan dan permintaan yang kritis.
• Manajemen Mitigasi Cerdas: Indikator mendeteksi ketika sebuah blok telah ditembus oleh harga, mengubah persegi panjang padat menjadi garis referensi putus-putus. Ini memungkinkan Anda menjaga grafik tetap bersih sambil mempertahankan breakout historis.
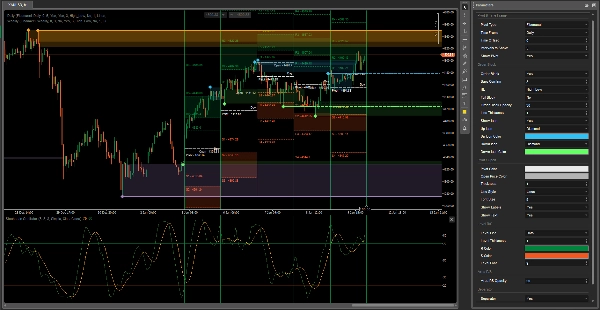
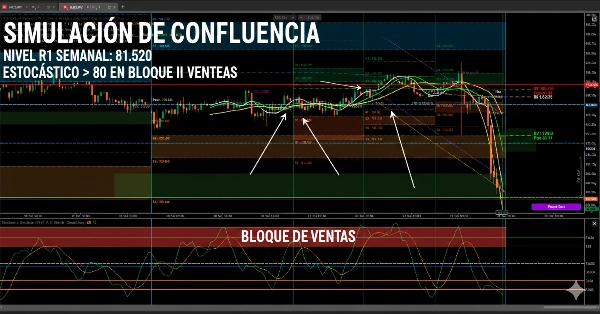
• Hirarki Multi-Timeframe (MTF): Dirancang untuk bekerja secara berlapis. Anda dapat menerapkan instance Harian untuk entri yang tepat dan instance Mingguan untuk menentukan bias pasar, memungkinkan Anda melihat konfluensi berdampak tinggi.
• Konfirmasi Profesional: Termasuk filter konfirmasi candlestick (Bars Confirm) untuk memastikan bahwa zona likuiditas valid dan bukan sekadar noise pasar.
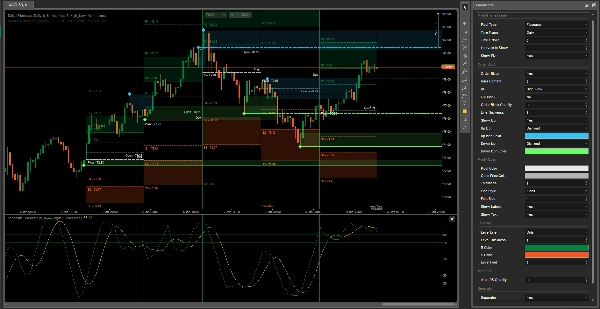
• Kustomisasi Estetika Penuh: Konfigurasikan warna, opasitas, dan gaya garis secara independen untuk setiap timeframe, memudahkan pembacaan harga dengan cepat di bawah tekanan.
Mengapa memilih TSPivotSMC?
Sementara pivot tradisional hanya memberikan angka, TSPivotSMC-V2 memberikan narasi pasar. Dengan menggabungkan level Fibonacci/Standar matematis dengan aksi harga institusional, Anda dapat melihat di mana uang berada dan kapan telah dimitigasi, memberikan Anda keunggulan kompetitif unik di cTrader.
Catatan untuk pengguna toko: "Disarankan menggunakan dua instance indikator (Harian dan Mingguan) untuk memaksimalkan efektivitas analisis likuiditas pada timeframe yang lebih tinggi."
Ringkasan
Designed for multi-timeframe analysis, TSPivotSMC-V2 supports layering daily and weekly instances to refine entry points and define overall market bias. It includes a candlestick confirmation filter to validate liquidity zones and reduce noise. Users can customize colors, opacities, and line styles independently for each timeframe to enhance visual clarity under trading pressure.
By combining mathematical pivot levels with institutional price action, this tool provides a detailed market narrative, helping traders identify where liquidity resides and when it has been mitigated. It is applicable across multiple markets including Forex, indices, commodities, cryptocurrencies, and stocks. Using multiple timeframe instances is recommended to maximize liquidity analysis effectiveness.
Ulasan pelanggan
5 | 100 % | |
4 | 0 % | |
3 | 0 % | |
2 | 0 % | |
1 | 0 % |


