
WVAP-Bands Indicator_noSourceCode
지표
1 구매
버전 1.0, Sep 2025
Windows, Mac
4.5
리뷰: 2
설명
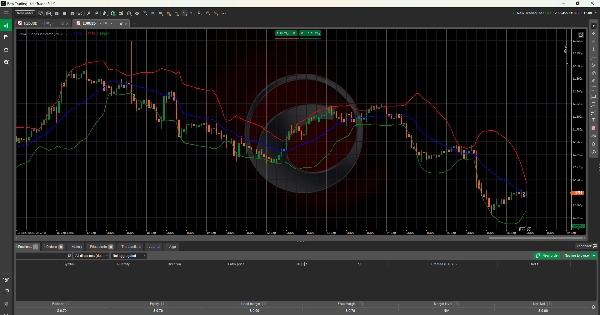
VWAP 밴드 - 전문 볼륨 분석
기관급 정밀도로 거래를 혁신하세요
VWAP 밴드 지표는 동적 표준 편차 밴드를 사용한 전문 볼륨 가중 가격 분석을 제공합니다. 전 세계 기관 트레이더들이 최적의 진입 및 청산 시점을 식별하는 데 사용합니다.
🚀 주요 기능
- 진정한 VWAP 계산: HLC/3 방식을 사용한 볼륨 가중 평균 가격
- 동적 밴드: 볼륨 가중 표준 편차 기반 상/하 밴드
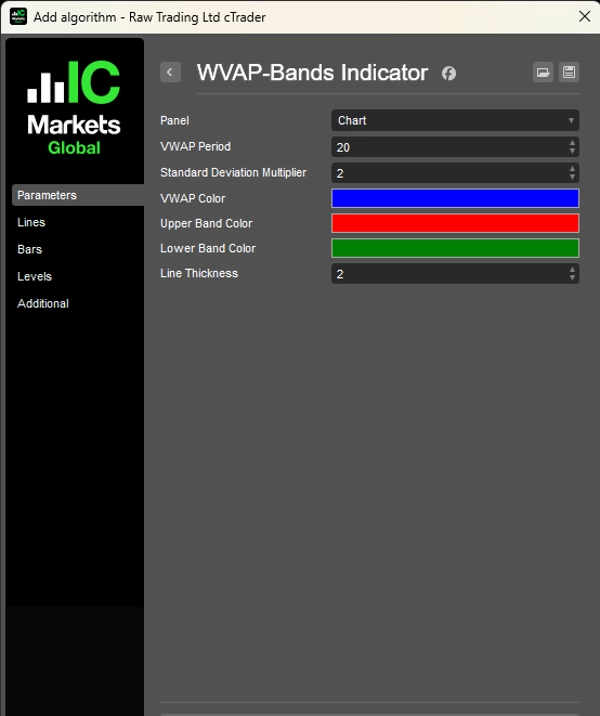
- 완전한 사용자 설정: 조정 가능한 기간, 색상 및 밴드 폭 배수
- 실시간 분석: 매 바마다 업데이트되어 즉각적인 시장 인사이트 제공
📊 거래 적용
- 과매수/과매도: 상단 밴드 = 매도 신호, 하단 밴드 = 매수 신호
- 동적 지지/저항: VWAP는 기관 참조 수준 역할
- 평균 회귀: 가격이 밴드 극단까지 확장될 때 반전 거래
- 추세 확인: 밴드를 통한 강한 돌파는 추세 지속 신호
⚙️ 전문 설정
- VWAP 기간: 1-200 바 (기본값: 20)
- 표준 편차: 0.1-5.0 배수 (기본값: 2.0)
- 시각적 사용자 설정: 사용자 지정 색상 및 선 두께
- 다중 타임프레임: 모든 타임프레임 및 도구에서 작동
✅ 왜 VWAP 밴드인가?
단순 이동 평균보다 우수한 VWAP 밴드는 다음을 제공합니다:
- 볼륨 가중 정확도로 진정한 기관 분석
- 적응형 변동성 밴드가 시장 상황에 맞게 조정
- 전문적 방법론을 전 세계 성공적인 트레이더들이 사용
- 범용 적용: 외환, 주식, 암호화폐, 원자재 전반에 걸쳐
전문 볼륨 분석을 추구하는 스캘퍼, 데이 트레이더 및 스윙 트레이더에게 완벽합니다.
cTrader 4.0+와 호환됩니다. 모든 도구 및 타임프레임에서 작동합니다.
요약
AI 요약
The WVAP-Bands Indicator provides volume-weighted average price (VWAP) analysis enhanced with dynamic standard deviation bands. It calculates VWAP using the HLC/3 price method and overlays upper and lower bands based on volume-weighted standard deviation, offering adaptive volatility measures. The indicator supports full customization of periods, colors, and band width multipliers, allowing traders to tailor it to their strategies. It updates in real time with each new bar, delivering immediate market insights.
Key trading applications include identifying overbought and oversold conditions (upper band signals sell, lower band signals buy), dynamic support and resistance levels with VWAP as an institutional reference, mean reversion opportunities when prices reach band extremes, and trend confirmation through breakouts beyond the bands. Settings allow adjustment of VWAP period (1–200 bars), standard deviation multiplier (0.1–5.0), and visual elements such as colors and line thickness.
The indicator is compatible with all timeframes and instruments, including forex, stocks, cryptocurrencies, commodities, and indices. It is designed for scalpers, day traders, and swing traders seeking professional-grade volume analysis and is compatible with cTrader 4.0 and above.
지표 프로필
고객 리뷰
4.5
리뷰: 2
5 | 50 % | |
4 | 50 % | |
3 | 0 % | |
2 | 0 % | |
1 | 0 % |
고객 리뷰
October 4, 2025
The sample size matters. The useful metric is POC and VWAP first, compare the result with 20 reactions, and only scale if 2 sessions still looks controlled.
October 3, 2025
I liked it more as a extra filter for volume based context than as something to follow blindly. Pressure is easier to read, and the final decision still feels like it belongs to the trader. The next review on it on value area.
상담
자주 묻는 질문(FAQ)
BTCUSD
Forex
Signal
Breakout
Indices
EURUSD
Commodities
GBPUSD
NZDUSD
Prop
Scalping
Crypto
Stocks
XAUUSD
NAS100
USDJPY
VWAP
트레이딩 봇, 지표, 플러그인 등 cTrader Store에서 제공되는 상품은 제3자 개발자에 의해 제공되며, 이는 단순히 정보 및 기술적 접근을 목적으로 제공된 것입니다. cTrader Store는 중개인이 아니며, 투자 조언, 개인별 추천 또는 향후 성과에 대한 어떠한 보장도 제공하지 않습니다.
이 작성자의 상품 더 보기


!["Wyckoff Toolkit [Iridio Capital]" 로고](https://cdn.ctrader.com/image/webp/8acfe6a1-6a8e-4578-9367-9df3af2b1801_27763)


가격
가입일 15/01/2025
7
판매