
คำอธิบาย
ตัวบ่งชี้ Pinescriptlabs Store: 🤖Pinescriptlabs Store cBots:
SmartTrend Support & Resistance Lines Gold & BTC Breakout Session Pivots(ใหม่) YieldShield" 🛡️
โครงสร้างตลาดแบบไดนามิก
การวิเคราะห์จุดเปลี่ยน
Fibonacci Linear
การถดถอยหลายกรอบเวลา
Multi-Level Candle Bias
Tracker
Auto Support and
Resistance Trend Lines
All Support and
Resistance Levels
ICT POWER OF 3 ⚡📊
ตัวบ่งชี้นี้ทำให้อัตโนมัติทฤษฎี ICT "Power of 3" โดยการวางโซนตลาดสำคัญสามโซนบนแผนภูมิของคุณ—การสะสม, การจัดการ, และการกระจาย—โดยใช้กรอบเวลาที่ปรับแต่งเพื่อจับทั้งช่วงเวลาบริสุทธิ์และช่วงเวลาทับซ้อน ผลลัพธ์คือ "แผนที่" 🗺️ ที่แสดงว่าผู้เล่นรายใหญ่ตั้งค่าการสนับสนุน, ล่าหยุด, และขับเคลื่อนแนวโน้ม—ไม่ต้องวิเคราะห์แท่งเทียนหรือไส้เทียนด้วยตนเอง!
ทำไมอัลกอริทึมนี้จึงสำคัญในการเทรด 💡
การมองเห็นของสถาบัน 👀: โดยการทำให้อัตโนมัติการตรวจจับโซนที่ "Smart Money" สะสม, จัดการ, และกระจาย คุณจะตัดการเดาและเห็นทันทีว่า สภาพคล่องจริง ไหลไปที่ไหน.
การตรวจจับกับดักและสภาพคล่อง 🎯: ระยะ การจัดการ (ช่วงทับซ้อนยุโรป-นิวยอร์ก) คือที่ที่ การล่าหยุด เกิดขึ้น—การสังเกตเห็นสิ่งเหล่านี้ช่วยให้คุณเข้าสู่การเทรดด้วย ความเสี่ยงต่ำกว่า.
การยืนยันแนวโน้ม 🚀: โซน การกระจายของนิวยอร์กบริสุทธิ์ จับแกนหลักของโมเมนตัมทิศทาง—การเทรดให้สอดคล้องกับมัน ช่วยเพิ่มอัตราความสำเร็จ.
ความสม่ำเสมอ 🔄: การใช้กรอบเวลาคงที่และภาพมาตรฐานช่วยลดอคติทางอารมณ์และ ทำให้การทดสอบย้อนหลังง่ายขึ้น.
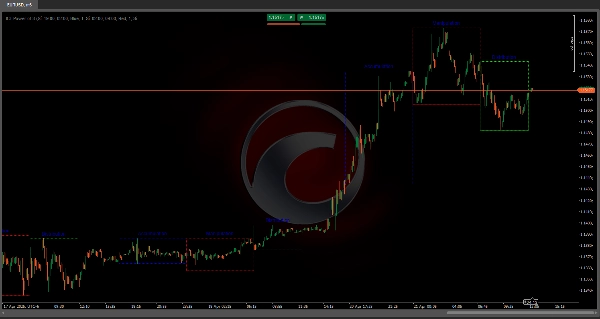
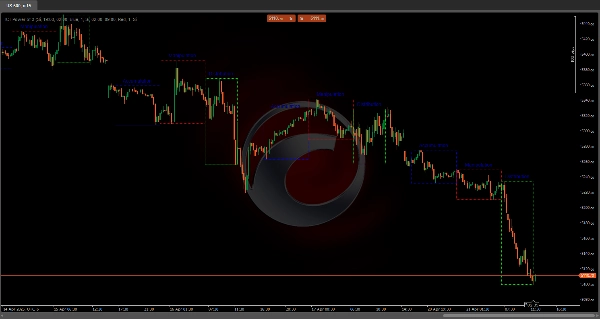
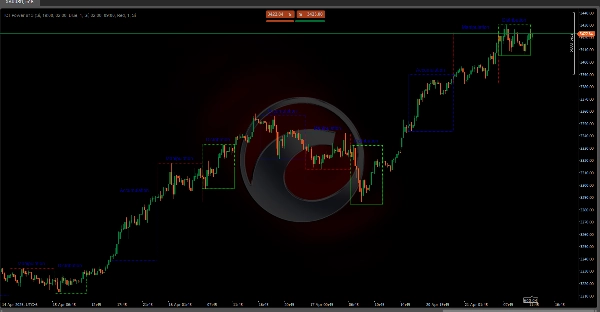
การตรวจจับสามระยะ (เน้นช่วงทับซ้อน) 🔍
1️⃣ การสะสม (เอเชีย + ช่วงทับซ้อนโตเกียว/ลอนดอน: 19:00 – 02:00 EST)
- เริ่มต้น ⏳: ที่แท่งเทียนแรกเวลา 19:00 EST, จะเปิด "กล่อง" จับสูง/ต่ำเริ่มต้น.
- ติดตาม 🔄: หากราคาทะลุช่วง (สูง/ต่ำใหม่), กล่องจะ ขยายแบบเรียลไทม์.
- ปิด 🚪: ที่เวลา 02:00 EST, กล่องจะล็อก, แสดงที่ที่ Smart Money ดูดซับคำสั่งด้วย ความผันผวนต่ำ.
2️⃣ การจัดการ (ยุโรป + ช่วงทับซ้อนลอนดอน/นิวยอร์ก: 02:00 – 09:00 EST)
- เริ่มต้น ⏳: ตรวจพบที่แท่งเทียนแรกเวลา 02:00 EST.
- พฤติกรรม 🎭: เน้น การหลอกลวงการทะลุ ของจุดสุดขีดก่อนหน้า—แต่ละการปฏิเสธจะถูกติดตามด้วยภาพ.
- ปิด 🚪: สิ้นสุดที่เวลา 09:00 EST, เผยให้เห็นที่ที่ การล่าหยุด ถูกเน้น.
3️⃣ การกระจาย (ช่วงนิวยอร์กบริสุทธิ์: 09:00 – 14:00 EST)
- เริ่มต้น ⏳: เริ่มต้นด้วยแท่งเทียนเวลา 09:00 EST.
- วิวัฒนาการ 📈: กล่องเติบโตพร้อมกับ แนวโน้มที่แข็งแกร่งที่สุด—ที่สถาบัน ปล่อยตำแหน่ง.
- ปิด 🚪: สรุปที่เวลา 14:00 EST, แสดงระยะ โมเมนตัมและปริมาณสูงสุด.
การจัดการวันและการล้างอัตโนมัติ 🧹
เพื่อหลีกเลี่ยงความรกบนแผนภูมิ ตัวบ่งชี้จะเก็บไว้เพียง จำนวนวันล่าสุด N วัน (ตั้งค่าได้) เมื่อเกินจะ ลบโซนเก่าโดยอัตโนมัติ—ขอบ, การเติม, และป้าย—ทำให้การวิเคราะห์ของคุณ สะอาดและเน้น ที่ข้อมูลล่าสุด.
สรุป
The indicator identifies:
1. Accumulation phase (7 PM – 2 AM EST, Asia + Tokyo/London overlap), marking where smart money absorbs orders with low volatility.
2. Manipulation phase (2 AM – 9 AM EST, Europe + London/New York overlap), highlighting false breakouts and stop hunts.
3. Distribution phase (9 AM – 2 PM EST, pure New York session), showing where institutions release positions during the highest momentum and volume.
ICT Power of 3 enhances trading by providing institutional visibility, trap and liquidity detection, and trend confirmation. It uses fixed timeframes and standardized visuals to reduce emotional bias and simplify backtesting. The indicator also manages chart clutter by automatically deleting old zones beyond a configurable number of days, keeping the analysis focused on recent data. It supports markets including commodities, cryptocurrencies (BTC, ETH), and symbols like BTCUSD and XAUUSD.
รีวิวจากลูกค้า
5 | 100 % | |
4 | 0 % | |
3 | 0 % | |
2 | 0 % | |
1 | 0 % |


