

คำอธิบาย
ตัวชี้วัด Pinescriptlabs Store: Pinescriptlabs Store cBots : (cBot) Gold & BTC BreakoutSession Pivots(ใหม่)
PRICE ACTION (ใหม่)
Trailing Smart Algorithm (ใหม่)
Prediction Based on Linreg & ATR
SmartTrend Support &
Resistance
Lines
Dynamic
Market Structure
Analysis
of
Turning
Points
Fibonacci
Linear
Regression
Multi-timeframe
Multi-Level
Candle Bias
Tracker
Auto
Support and
Resistance
Trend
Lines
All
Support and
Resistance
Levels
คำอธิบาย:
ระบบซื้อขายแนวโน้ม HTF ขั้นสูง
มันคืออะไรและใช้ทำอะไร?
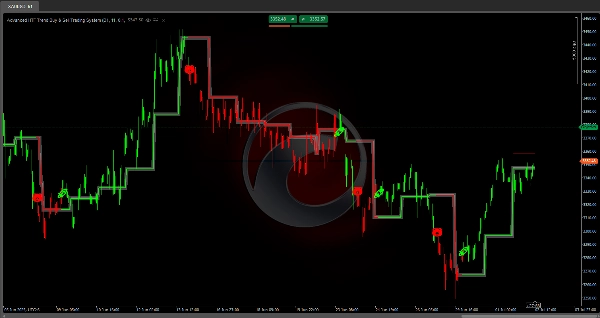
มันคือ อัลกอริทึมวิเคราะห์ทางเทคนิค ที่ระบุระดับแนวรับและแนวต้านโดยอัตโนมัติ 📈 ตามช่วงราคาประวัติศาสตร์ และตรวจจับเมื่อราคาทะลุระดับเหล่านี้เพื่อสร้างสัญญาณแนวโน้ม 💡.
ตรรกะทำงานอย่างไร?
1️⃣ การคำนวณช่วงราคา
ตัวชี้วัดวิเคราะห์ช่วงเวลาประวัติศาสตร์ที่กำหนด (ปรับแต่งได้เต็มที่) เพื่อหา:
• ราคาสูงสุด ที่ถึงในช่วงเวลานั้น 📊
• ราคาต่ำสุด ที่ถึงในช่วงเวลานั้น 📉
• จุดกึ่งกลาง ระหว่างสองระดับ ⚖️
2️⃣ การกำหนดระดับ
เมื่อระบุค่าขีดสุดแล้ว ตัวชี้วัดจะ:
• วาด เส้นสีแดง ที่ระดับสูงสุด (แนวต้าน)
• วาด เส้นสีเขียว ที่ระดับต่ำสุด (แนวรับ)
• เพิ่ม บัฟเฟอร์ความปลอดภัย ให้แต่ละระดับเพื่อป้องกันสัญญาณผิดพลาด 🛡️
3️⃣ การตรวจจับการทะลุ
ระบบตรวจสอบราคาตลอดเวลาเพื่อจับ:
• การทะลุบวก 🚀: เมื่อราคาปิดเหนือระดับแนวต้าน + บัฟเฟอร์
• การทะลุลบ 🐻: เมื่อราคาปิดต่ำกว่าระดับแนวรับ - บัฟเฟอร์
4️⃣ ระบบยืนยัน
ก่อนสร้างสัญญาณสุดท้าย ✅ ตัวชี้วัดจะ:
• รอจำนวนแท่งเทียนติดต่อกันที่กำหนดเพื่อยืนยันการทะลุ ⏳
• หลังจากยืนยันแล้วเท่านั้นจึง เปลี่ยนแนวโน้มอย่างเป็นทางการ
5️⃣ การอัปเดตแบบไดนามิก
ระดับจะถูกคำนวณใหม่โดยอัตโนมัติ:
• เมื่อเริ่มช่วงเวลาใหม่ (รายวัน รายสัปดาห์ หรือรายเดือน ขึ้นอยู่กับการตั้งค่าของคุณ) 🔄
• เส้นจะขยายจนกว่าจะตั้งค่าระดับใหม่
• เส้นกึ่งกลาง เปลี่ยนสีตามแนวโน้มปัจจุบัน
วิธีใช้ ?
✨ สัญญาณ:
• ซื้อ: สัญลักษณ์ 🚀 ปรากฏเมื่อยืนยันการทะลุบวก
• ขาย: สัญลักษณ์ 🐻 ปรากฏเมื่อยืนยันการทะลุลบ
🎨 การระบายสีแท่งเทียน:
• แท่งเทียนจะถูกระบายสีโดยอัตโนมัติตามแนวโน้มปัจจุบัน:
✅ สีเขียว: แนวโน้มขาขึ้นที่ใช้งานอยู่
❌ สีแดง: แนวโน้มขาลงที่ใช้งานอยู่
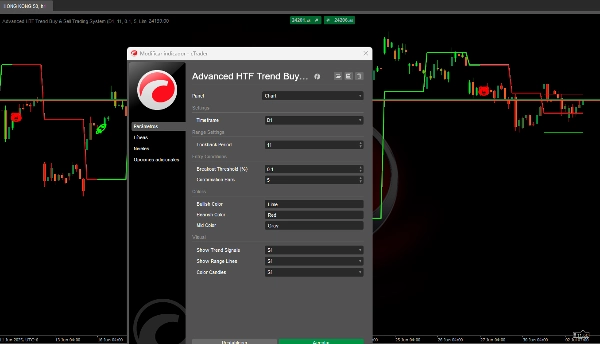
การตั้งค่าพารามิเตอร์
🔧 ช่วงเวลาย้อนหลัง (5–200, ค่าเริ่มต้น: 11)
ควบคุมอะไร?
จำนวนแท่งเทียนประวัติศาสตร์ที่ใช้ในการคำนวณราคาสูงสุดและต่ำสุด.
ผลกระทบเมื่อปรับเปลี่ยน:
• ค่าต่ำ (5–15):
- ระดับที่ ตอบสนองและบ่อยครั้งมากขึ้น
- จำนวนสัญญาณที่สูงขึ้น
- เหมาะสำหรับ การเก็งกำไรและการเทรดระยะสั้น
- เหมาะสำหรับ ตลาดที่มีความผันผวนสูง
• ค่าสูง (30–50):
- ระดับที่ มั่นคงและยั่งยืนมากขึ้น 🏛️
- สัญญาณน้อยลงแต่เชื่อถือได้มากขึ้น
- เหมาะสำหรับ การเทรดสวิงและตำแหน่งระยะกลาง
- เหมาะสำหรับ ตลาดที่มีความมั่นคงมากขึ้น
📏 เกณฑ์การทะลุ (0.01–5.0%, ค่าเริ่มต้น: 0.1%)
ควบคุมอะไร?
บัฟเฟอร์เพิ่มเติมที่ราคาต้องเกินเพื่อยืนยันการทะลุ.
ผลกระทบเมื่อปรับเปลี่ยน:
• ค่าต่ำ (0.05–0.15%):
- สัญญาณที่เร็วและไวต่อการเปลี่ยนแปลงมากขึ้น 🔍
- ความเสี่ยงสูงของ การทะลุเท็จ
- เหมาะสำหรับ Forex majors ที่มีสเปรดต่ำ
- เหมาะสำหรับ ตลาดที่มีสภาพคล่องสูง
• ค่าสูง (0.3–1.0%):
- สัญญาณที่ช้ากว่าแต่ เชื่อถือได้มากขึ้น 🛡️
- ความเสี่ยงของเสียงรบกวนในตลาดต่ำกว่า
- เหมาะสำหรับ สกุลเงินดิจิทัลและสินทรัพย์ที่ผันผวน
- เหมาะสำหรับ ตลาดที่มีสเปรดกว้างขึ้น
⏳ จำนวนแท่งเทียนยืนยัน (1–5, ค่าเริ่มต้น: 1)
ควบคุมอะไร?
จำนวนแท่งเทียนติดต่อกันที่ต้องยืนยันการทะลุก่อนสร้างสัญญาณ.
ผลกระทบเมื่อปรับเปลี่ยน:
• 1 แท่ง:
- สัญญาณทันที ⚡
- โอกาสในการเทรดมากขึ้น
- ความเสี่ยงสูงของ สัญญาณก่อนเวลา
- เหมาะสำหรับ เทรดเดอร์ที่ใช้งานอยู่
• 2–3 แท่ง:
- สมดุลระหว่าง ความเร็วและความน่าเชื่อถือ ⚖️
- ลดสัญญาณผิดพลาดอย่างมีนัยสำคัญ
- เหมาะสำหรับ กลยุทธ์ส่วนใหญ่
• 4–5 แท่ง:
- สัญญาณที่ ระมัดระวังมาก 🕊️
- ความน่าเชื่อถือสูงสุด
- อาจ พลาดโอกาสในช่วงต้น
- เหมาะสำหรับ ตำแหน่งระยะยาว
📊 การปรับแต่งตามประเภทสินทรัพย์
💱 Forex Majors (EUR/USD, GBP/USD, ฯลฯ)
• ช่วงเวลาย้อนหลัง: 15–25
• เกณฑ์: 0.05–0.15%
• การยืนยัน: 1–2 แท่ง
💰 สกุลเงินดิจิทัล
• ช่วงเวลาย้อนหลัง: 10–20
• เกณฑ์: 0.2–0.8%
• การยืนยัน: 2–3 แท่ง
📈 ดัชนีหุ้น
• ช่วงเวลาย้อนหลัง: 20–30
• เกณฑ์: 0.1–0.3%
• การยืนยัน: 1–2 แท่ง
🌾 สินค้าโภคภัณฑ์
• ช่วงเวลาย้อนหลัง: 25–35
• เกณฑ์: 0.15–0.4%
• การยืนยัน: 2–3 แท่ง
ข้อควรพิจารณา
• อาจสร้าง สัญญาณล่าช้า ในตลาดที่เคลื่อนไหวเร็วมาก 🏃♂️
• มีประสิทธิภาพน้อยลงใน ตลาดที่เคลื่อนไหวในแนวราบอย่างมาก
• ต้องปรับพารามิเตอร์ตาม สินทรัพย์และกรอบเวลา ⏱️
สรุป
The system continuously monitors price action to detect bullish breakouts (price closing above resistance plus buffer) and bearish breakouts (price closing below support minus buffer). It includes a confirmation mechanism that waits for a configurable number of consecutive bars confirming the breakout before officially signaling a trend change. The midpoint line changes color to reflect the current trend, and all levels update dynamically at the start of new periods (daily, weekly, or monthly).
Signals are visually indicated with symbols: a rocket (🚀) for confirmed bullish breakouts and a bear (🐻) for confirmed bearish breakouts. Candles are colored green for active bullish trends and red for bearish trends.
Key adjustable parameters include lookback period (5–200 bars), breakout threshold buffer (0.01–5.0%), and confirmation bars (1–5). These settings can be optimized for various asset types such as Forex majors, cryptocurrencies, stock indices, and commodities, balancing signal frequency, reliability, and market conditions. The indicator supports multiple timeframes and is suitable for scalping, swing trading, and longer-term strategies depending on configuration.


