
Description
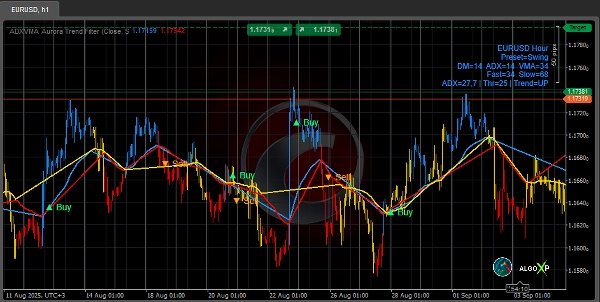
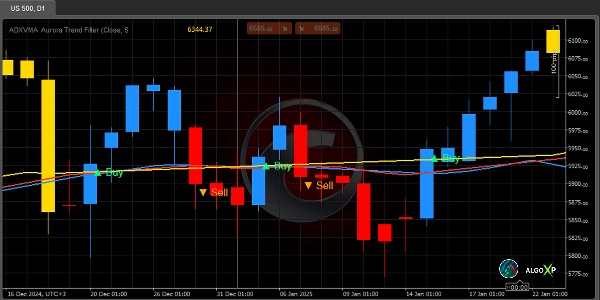
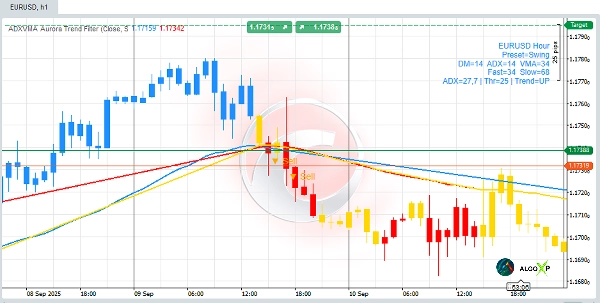
⚡ Filtre de tendance ADXVMA Aurora combine la force de la tendance ADX avec un mélange EMA adaptatif pour former une base de trading fiable. Contrairement aux indicateurs ordinaires avec un lissage fixe, Aurora s'ajuste en temps réel—plus proche du prix dans les tendances fortes, plus lisse dans les plages—et affiche un biais clair Haut / Bas / Neutre avec des flèches de croisement optionnelles. Le résultat est plus de réactivité que les MM statiques et plus de stabilité que l'ADX seul.
🆚 Pourquoi il est plus puissant que les indicateurs ordinaires
- Par rapport aux MM fixes : le coefficient adaptatif réduit le retard dans les tendances et filtre les oscillations dans les plages.
- Par rapport à l'ADX brut : transforme la force en une base de trading exploitable (avec couleurs & signaux de croisement), pas seulement un chiffre.
- Par rapport aux filtres génériques : un EMA rapide/lente pondérée par l'ADX offre un mélange équilibré de sensibilité et de stabilité.
🧠 Le moteur : mélange EMA pondéré par l'ADX
ADX (0…100) mesure la force de la tendance. Aurora mélange une EMA rapide et une EMA lente, utilisant l'ADX comme poids :
- ADX élevé → biais vers rapide (moins de retard).
- ADX faible → biais vers lent (meilleur filtrage du bruit).
La ligne est codée par couleur selon la pente (et peut être bloquée en Neutre lorsque l'ADX est faible), produisant une lecture claire Bleu / Rouge / Jaune.
🔭 Ce qu'il fait
- Base adaptative : mélange EMA rapide & lente en utilisant l'ADX comme poids.
- Couleurs à trois états : Bleu (Hausse), Rouge (Baisse), Jaune (Neutre).
- Barres colorées : coloration des chandeliers pour un contexte instantané.
- Flèches de croisement : modes Par tendance (Classique) ou Tous les croisements (Simple).
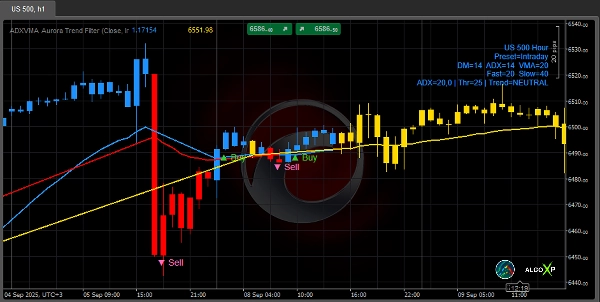
- Tableau de bord : périodes en direct, ADX et état de la tendance.
- Prêt pour bot : séries cachées TrendState (−1/0/+1) et ADX pour cBots/scanners.
🎯 Comment le trader
- Biais : Au-dessus de la ligne + bleu → privilégier les positions longues ; en dessous de la ligne + rouge → privilégier les positions courtes ; jaune → rester à l'écart.
- Entrée : prendre la flèche au croisement du prix avec la ligne de base (choisir Par tendance ou Tous les croisements).
- Sortie : stop au niveau ligne Aurora ± tampon ; prendre les profits via RR≥2 ou au croisement/opposé changement de couleur.
🚀 Préréglages (démarrage rapide)
- Scalp : VMA=12 · ADX=14 · Seuil ADX=28 · Pente Neutre=0.04 · Lien=VMA→2×VMA
- Intraday : VMA=20 · ADX=14 · Seuil ADX=25 · Pente Neutre=0.06 · Lien=VMA→2×VMA
- Swing : VMA=34 · ADX=14 · Seuil ADX=23 · Pente Neutre=0.10 · Lien=VMA→2×VMA
- Position : VMA=55 · ADX=14 · Seuil ADX=20 · Pente Neutre=0.15 · Lien=VMA→2×VMA
🔧 Paramètres clés
- Périodes DM / ADX / VMA (séparées, style Wilder).
- Utiliser le DM authentique (Wilder) : +DM/−DM stricts (recommandé Activé).
- Lien d'adaptation : Lien vers VMA (Rapide=VMA, Lent≈2×VMA) ou Manuel Rapide/Lent.
- Pente Neutre (pips) : sensibilité de la pente par barre.
- Plat si ADX < Seuil : forcer Neutre pendant une tendance faible (Activé/Désactivé).
- Flèches / Barres colorées / Tableau de bord : activé/désactivé ; Mode Flèche : Par tendance / Tous les croisements.
🎯 Parfait pour :
- Scalpers, traders intraday et swing cherchant un filtre de tendance clair + des déclencheurs simples
- Traders algorithmiques ayant besoin de séries stables et lisibles par machine.
🧭 Conseils sur les périodes et marchés
- TF inférieurs (M1–M5) : plus de bruit → commencer avec VMA 10–14, Pente Neutre 0.04–0.08, Seuil ADX 25–30.
- Intraday (M15–H1) : VMA 18–24, Pente Neutre 0.06–0.12, Seuil ADX 22–28.
- TF supérieurs (H4–D1) : VMA 30–60, Pente Neutre 0.10–0.25, Seuil ADX 20–25.
- Majors vs. Volatiles (XAU, Crypto) : augmenter VMA / Pente Neutre / Seuil d'un cran pour les marchés volatils.
Résumé
The core mechanism uses ADX (0–100) to weight a fast and slow EMA: high ADX values favor the fast EMA for responsiveness, while low ADX values favor the slow EMA for stability. This approach delivers more responsiveness than static moving averages and greater stability than ADX alone.
Key features include candle color bars for instant trend context, a dashboard showing live periods and trend states, and hidden series outputs (TrendState and ADX) suitable for algorithmic trading and scanners. It supports multiple preset configurations for scalping, intraday, swing, and position trading, with adjustable parameters for trend detection sensitivity and noise filtering.
The indicator is applicable across various markets including Forex, indices, commodities, stocks, and cryptocurrencies, and is designed for use on multiple timeframes from one minute to daily charts. It is suitable for traders seeking a clear trend filter with simple triggers and for algo traders requiring stable, machine-readable signals.
Avis clients
5 | 33 % | |
4 | 67 % | |
3 | 0 % | |
2 | 0 % | |
1 | 0 % |


