
ORB_BRSTrading
อินดิเคเตอร์
1 การซื้อ
เวอร์ชัน 1.0, Nov 2025
Windows, Mac
4.6
รีวิว: 3
คำอธิบาย
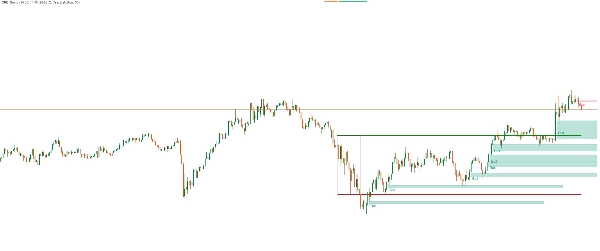
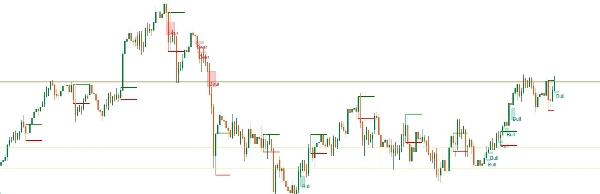
ตัวบ่งชี้นี้ใช้กลยุทธ์การซื้อขาย Opening Range Breakout (ORB) ซึ่งออกแบบมาเพื่อจับโมเมนตัมในช่วงเวลาที่มีความผันผวนสูงที่สุดของช่วงการซื้อขาย โดยจะระบุช่วงเปิดตามพารามิเตอร์เวลาที่ผู้ใช้กำหนดและแสดงระดับการเบรกเอาต์สำหรับสัญญาณเข้า กลยุทธ์นี้มีเป้าหมายเพื่อใช้ประโยชน์จากการเคลื่อนไหวของราคาเมื่อตลาดทะลุขึ้นหรือลงจากช่วงเริ่มต้น ซึ่งมักจะบ่งชี้ถึงแนวโน้มทิศทางที่แข็งแกร่ง
คุณสมบัติหลัก:
- หน้าต่างเวลาช่วงเปิดที่ปรับแต่งได้
- การคำนวณระดับเบรกเอาต์โดยอัตโนมัติ
- การแจ้งเตือนด้วยภาพสำหรับการยืนยันเบรกเอาต์
- ใช้งานได้กับหลายกรอบเวลาและเครื่องมือ
- เหมาะสำหรับผู้ซื้อขายรายวันที่มองหาการตั้งค่าที่มีความน่าจะเป็นสูง
วิธีการทำงาน:
- กำหนดช่วงเปิด (สูงและต่ำ) สำหรับช่วงเวลาที่ระบุ
- ตรวจสอบการเคลื่อนไหวของราคาเพื่อหาการเบรกเอาต์ที่เกินช่วงนี้
- สร้างสัญญาณการซื้อขายตามทิศทางของเบรกเอาต์และตัวกรองเสริม (เช่น ปริมาณ, ความผันผวน)
สรุป
สรุปโดย AI
ORB_BRSTrading is an indicator implementing an Opening Range Breakout (ORB) trading strategy aimed at capturing momentum during the most volatile period of a trading session. It defines the opening range high and low based on user-specified time parameters and automatically calculates breakout levels. The indicator monitors price action for breakouts beyond this range and generates trade signals according to breakout direction, with optional filters such as volume or volatility. It provides visual alerts to confirm breakouts and supports multiple timeframes and instruments, making it suitable for intraday traders seeking high-probability setups. The strategy is applicable across various markets including Forex, stocks, indices, and symbols like BTCUSD, EURUSD, GBPUSD, XAUUSD, NAS100, and USDJPY.
โปรไฟล์อินดิเคเตอร์
รีวิวจากลูกค้า
4.6
รีวิว: 3
5 | 67 % | |
4 | 33 % | |
3 | 0 % | |
2 | 0 % | |
1 | 0 % |
รีวิวจากลูกค้า
February 9, 2026
ORB_BRSTrading is a solid Opening Range Breakout tool. Clean visuals and reliable logic make it work best on M10-H4. Great for intraday and session-based breakout strategies. Less effective on very low or very high timeframes.
December 10, 2025
December 2, 2025
การสนทนา
คำถามที่พบบ่อย
BTCUSD
Forex
Breakout
Indices
EURUSD
GBPUSD
NZDUSD
Stocks
XAUUSD
NAS100
USDJPY
ผลิตภัณฑ์ที่มีให้บริการผ่าน cTrader Store รวมถึงบอทการเทรด อินดิเคเตอร์ และปลั๊กอิน มีให้บริการโดยนักพัฒนาบุคคลที่สามและมีไว้เพื่อวัตถุประสงค์ในการเข้าถึงข้อมูลและทางเทคนิคเท่านั้น cTrader Store ไม่ใช่โบรกเกอร์และไม่ได้ให้คำแนะนำการลงทุน คำแนะนำส่วนบุคคล หรือการรับประกันผลการดำเนินงานในอนาคต
เพิ่มเติมจากผู้เขียนคนนี้


ราคา
ตั้งแต่ 22/10/2025
303.42M
ปริมาณการเทรด
49
Pips ที่ได้กำไร
1
การขาย