คำอธิบาย
🚀 เทรดเดอร์กว่า 10,000 คนใช้ ตัวชี้วัด ชั้นนำของเรา 🏆
👉 รับระบบชั้นนำทั้งหมดของเราที่นี่:
_______________________________________________
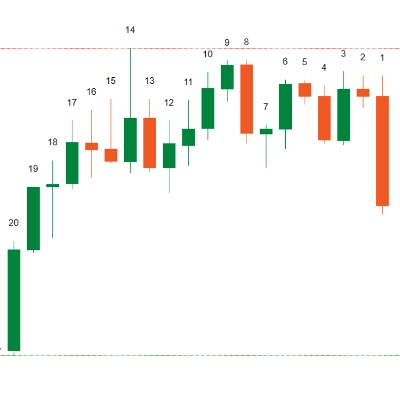
📌 ตัวชี้วัดโครงสร้างตลาด
· ✅ AdvancedMarket Structure: Bos, Choch, SwinLevels, Order Blocks, Market Structure& Liquidity Finder
· 🔄 Dynamic Market StructureAnalysis of Turning Points
· 🧱 Order Block
· ⚖️ Market Imbalance
· ⛓️ BOS & CHOCH
· 🧠 ICT Power of 3
_______________________________________________
🔚 ระบบออกอัจฉริยะ
_______________________________________________
📐 ตัวชี้วัด ZigZag
· 🔍 ZigZag Price LiquidityProjection
· ➖ ZigZag
_______________________________________________
🧱 ตัวชี้วัดแนวรับและแนวต้าน
· 🟩 SmartTrend Support &Resistance Lines
· 🧱 All Support and ResistanceLevels
_______________________________________________
📊 ตัวชี้วัดแนวโน้มและช่องทาง
· 📊 Supertrend
_______________________________________________
💧 เครื่องมือปริมาณและสภาพคล่อง
_______________________________________________
⚡ ตัวชี้วัดโมเมนตัมและ RSI
· 🔎 Multi-Level Candle Bias
Tracker
_______________________________________________
🔮 เครื่องมือทำนายและคาดการณ์
· 📐 Prediction Based on Linreg& ATR
· 📏 Fibonacci Linear RegressionMulti-timeframe
· 📈 Volume-Powered Market Flow Projector
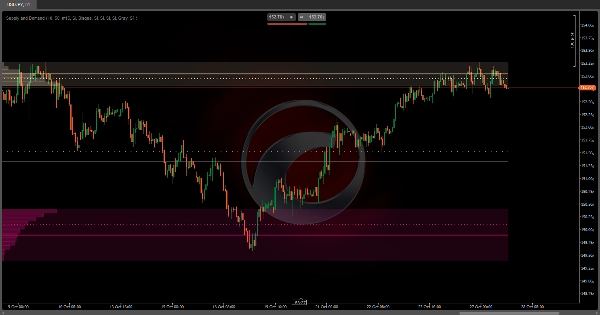
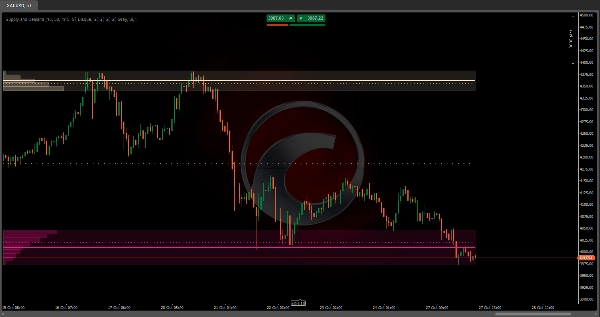
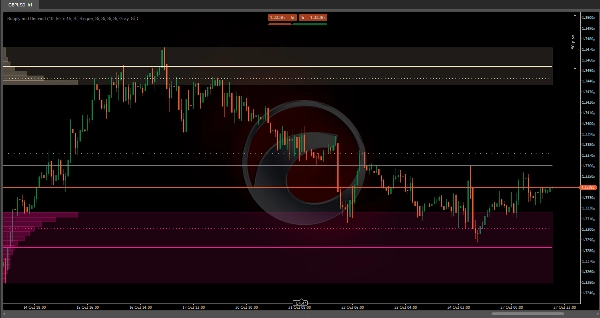
อุปทานและอุปสงค์อัตโนมัติ: 💹
อุปทานและอุปสงค์อัตโนมัติเป็นตัวชี้วัดการวิเคราะห์ปริมาณขั้นสูงที่ระบุโซนที่มีกิจกรรมการซื้อขายสูงสุดบนแผนภูมิของคุณโดยอัตโนมัติ 📊 แตกต่างจากตัวชี้วัดแบบคงที่อื่น ๆ ตัวนี้จะปรับตัวแบบไดนามิกตามช่วงมองเห็นที่คุณกำลังดู โดยคำนวณโซนใหม่ทุกครั้งที่คุณซูมหรือเลื่อนผ่านแผนภูมิ
มันทำงานอย่างไร? ❓
อัลกอริทึมจะแบ่งช่วงราคาที่มองเห็นออกเป็นหลายระดับแนวนอน (ปรับแต่งได้ตั้งแต่ 2 ถึง 500 แบ่ง) และวิเคราะห์ปริมาณที่ซื้อขายในแต่ละระดับ เพื่อความแม่นยำมากขึ้น มันใช้ข้อมูลจากกรอบเวลาที่ต่ำกว่าที่คุณกำลังดู 🕒 ตัวอย่างเช่น หากคุณดูแผนภูมิ 1 ชั่วโมง มันสามารถวิเคราะห์แท่งเทียน 15 นาทีเพื่อระบุรายละเอียดว่าปริมาณจริง ๆ ถูกกระจุกตัวอยู่ที่ใด
กระบวนการระบุ 🔍
ตัวชี้วัดทำงานจากขอบเขตไปยังศูนย์กลาง:
- จากราคาสูงสุด: 🚀 เริ่มจากจุดสูงสุดของช่วงที่มองเห็นและลดระดับลงทีละระดับ โดยสะสมปริมาณที่ซื้อขายในแต่ละช่วงราคา
- จากราคาต่ำสุด: 📉 พร้อมกันนั้น มันจะขึ้นจากจุดต่ำสุด โดยสะสมปริมาณในทิศทางขึ้น
- เกณฑ์การเปิดใช้งาน: ⚡ เมื่อโซนใดโซนหนึ่งสะสมปริมาณถึงเปอร์เซ็นต์ที่กำหนดของปริมาณรวม (ปรับแต่งได้ ค่าเริ่มต้น 10%) จะถูกทำเครื่องหมายว่าเป็นโซนสำคัญและการค้นหาในทิศทางนั้นจะหยุดลง
- โซนกลาง: ⚖️ เมื่อทั้งสองโซน (บนและล่าง) ถูกระบุแล้ว พื้นที่ตรงกลางจะถูกทำเครื่องหมายว่าเป็นโซนกลางหรือโซนสมดุล
ใช้ทำอะไร? 🎯
ตัวชี้วัดนี้เป็นเครื่องมือวิเคราะห์โครงสร้างตลาดที่ช่วยให้คุณ:
- ระบุ โซนอุปทาน: 🏔️ พื้นที่บนที่เคยมีการขายสูงในอดีต
- ระบุ โซนอุปสงค์: 🏖️ พื้นที่ล่างที่มีกิจกรรมการซื้อสูง
- ตรวจจับ โซนสมดุล: 🎭 ช่วงกลางที่แรงกดดันจากการซื้อและขายสมดุลกัน
โซนเหล่านี้มักจะทำหน้าที่เหมือนแม่เหล็กดึงราคามาในอนาคต เนื่องจากเป็นระดับที่ผู้เข้าร่วมจำนวนมากเคยเปิดตำแหน่งไว้ 🧲
สามารถผสมผสานอย่างไรได้บ้าง? 🔗
กับกลยุทธ์ราคาแอคชัน:
- รอ การทดสอบซ้ำ ของโซนที่ระบุเพื่อค้นหาการยืนยันการกลับตัว
- ใช้โซนเป็น เป้าหมายการทำกำไร หรือ จุดวางหยุดขาดทุน.
กับตัวชี้วัดแนวโน้ม:
- ใน แนวโน้มขาขึ้น, มองหาจุดเข้าเมื่อราคาทดสอบซ้ำโซนอุปสงค์ด้านล่าง 📈
- ใน แนวโน้มขาลง, ใช้โซนอุปทานด้านบนเป็นแนวต้านสำหรับการขาย 📉
กับการวิเคราะห์หลายกรอบเวลา:
- ระบุโซนใน กรอบเวลาที่สูงกว่า และมองหาการยืนยันในกรอบเวลาที่ต่ำกว่า
- โซนจากกรอบเวลาที่สูงกว่าสามารถประกอบด้วยหลายโซนในกรอบเวลาที่ต่ำกว่า
กับตัวชี้วัดโมเมนตัม:
- ผสมผสานกับ RSI หรือ Stochastic เพื่อยืนยันสภาวะซื้อมาก/ขายมากในโซนเหล่านี้
- ความเบี่ยงเบน ในโซนอุปทาน/อุปสงค์สามารถบ่งชี้การกลับตัวที่เป็นไปได้
การตั้งค่าที่ปรับแต่งได้ ⚙️
ตัวชี้วัดอนุญาตให้คุณปรับแต่ละโซนได้อย่างอิสระ:
- เปิด/ปิดใช้งานแต่ละองค์ประกอบภาพ (พื้นที่, เส้นค่าเฉลี่ย, เส้นถ่วงน้ำหนัก)
- เกณฑ์ปริมาณ: เปอร์เซ็นต์ของปริมาณรวมที่ต้องสะสมเพื่อพิจารณาว่าโซนนั้นสำคัญ
- การแบ่งราคา: จำนวนที่สูงขึ้น = ความแม่นยำมากขึ้นแต่คำนวณมากขึ้น
- กรอบเวลาที่ต่ำกว่า: กำหนดความละเอียดของการวิเคราะห์ปริมาณ
คุณสมบัติสำคัญ: การปรับตัวอัตโนมัติ 🔄
คำนวณใหม่โดยอัตโนมัติตามมุมมองของคุณ ซึ่งหมายความว่า:
- ถ้าคุณ ซูมเข้า เพื่อดูรายละเอียดของช่วงเวลา มันจะระบุโซนอุปทานและอุปสงค์เฉพาะสำหรับช่วงเวลานั้น
- ถ้าคุณ ซูมออก เพื่อดูสัปดาห์หรือเดือน มันจะคำนวณโซนขนาดใหญ่สำหรับช่วงเวลาทั้งหมดใหม่
- ทุกครั้งที่คุณ เลื่อน ผ่านแผนภูมิ โซนจะอัปเดตเพื่อสะท้อนบริบทของช่วงที่มองเห็น
สรุป
The indicator divides the visible price range into configurable horizontal levels (2 to 500 divisions) and analyzes volume traded at each level using data from a lower timeframe than the chart’s timeframe for enhanced accuracy. It identifies significant zones by accumulating volume from the highest and lowest visible prices until a configurable volume threshold (default 10%) is reached, marking these as supply and demand zones respectively. The area between these zones is designated as a balance zone, representing equilibrium between buying and selling pressures.
These zones highlight areas of historically high trading activity that often act as future price magnets. The indicator supports customization of visual elements, volume thresholds, price divisions, and analysis timeframe. It can be combined with price action strategies, trend indicators, multiple timeframe analysis, and momentum indicators like RSI or Stochastic to improve trade entries, exits, and confirmations.
Supported markets include Forex, Indices, Commodities, Stocks, and Cryptocurrencies, with symbols such as EURUSD, GBPUSD, BTCUSD, XAUUSD, and NAS100.
รีวิวจากลูกค้า
5 | 50 % | |
4 | 0 % | |
3 | 0 % | |
2 | 0 % | |
1 | 50 % |