

คำอธิบาย
# 🚀 ดัชนีการลื่นไถลเชิงจลน์ (KSI) – เครื่องมือวิเคราะห์แรงกดดันตลาดขั้นสูง & สภาพคล่อง
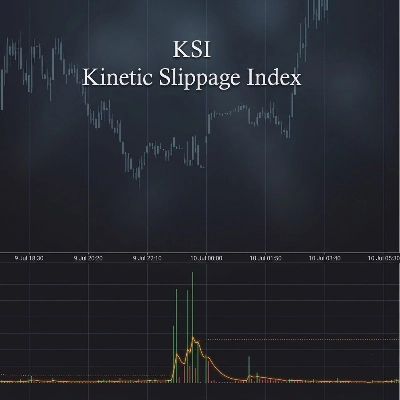
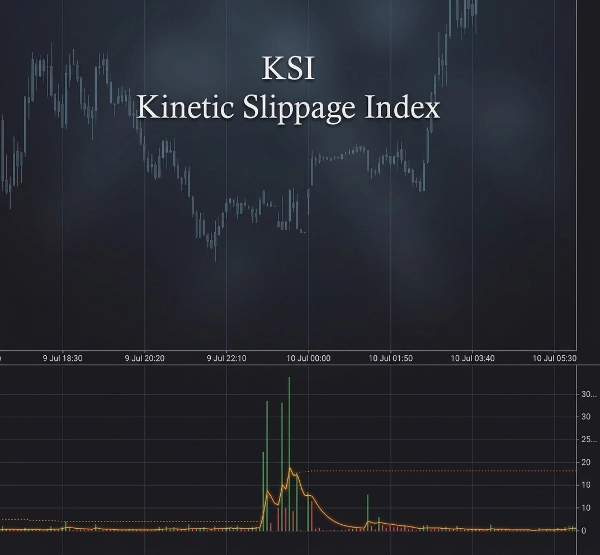
ปลดล็อกข้อมูลเชิงลึกของตลาดอย่างลึกซึ้งด้วย **ดัชนีการลื่นไถลเชิงจลน์ (KSI)** — ตัวบ่งชี้การซื้อขายที่ทรงพลังออกแบบมาเพื่อระบุการเคลื่อนไหวของราคาที่ผิดปกติ ความไม่สมดุลของปริมาณ และเหตุการณ์สภาพคล่องที่อาจเกิดขึ้นก่อนที่จะเห็นได้ชัดบนแผนภูมิ
สร้างขึ้นสำหรับผู้ซื้อขายที่วิเคราะห์ **โครงสร้างตลาด พฤติกรรมปริมาณ ความผันผวน และกิจกรรมสถาบัน** KSI ผสมผสานการขยายช่วงและพลวัตของปริมาณเพื่อวัดสภาพตลาดที่ผิดปกติ
## 🔥 คุณสมบัติหลัก
✅ **การคำนวณดัชนีการลื่นไถลเชิงจลน์**
* วัดความสัมพันธ์ระหว่างการเคลื่อนไหวของราคาและปริมาณที่ซื้อขาย
* ตรวจจับสถานการณ์ที่ราคาขยับอย่างไม่สมส่วนเมื่อเทียบกับพฤติกรรมปริมาณปกติ
* ช่วยระบุความเครียดของสภาพคล่องที่อาจเกิดขึ้น กิจกรรมตลาดที่รุนแรง และโมเมนตัมที่ผิดปกติ
✅ **การตรวจจับสไปค์แบบปรับตัว**
* คำนวณระดับสไปค์แบบไดนามิกโดยอัตโนมัติตามพฤติกรรมตลาดล่าสุด
* ใช้วิเคราะห์การเบี่ยงเบนทางสถิติเพื่อเน้นเหตุการณ์ตลาดที่รุนแรง
* ปรับตัวเข้ากับสภาพความผันผวนที่เปลี่ยนแปลงโดยไม่ต้องปรับด้วยมืออย่างต่อเนื่อง
✅ **การแจ้งเตือนสไปค์แบบเรียลไทม์ 🚨**
* รับการแจ้งเตือนเมื่อเกิดความเบี่ยงเบนของปริมาณ/ช่วงที่ผิดปกติ
* ช่วยให้ผู้ซื้อขายระบุเงื่อนไขการเบรกเอาต์ที่อาจเกิดขึ้น การจับสภาพคล่อง หรือแรงกดดันตลาดอย่างรวดเร็ว
✅ **การวิเคราะห์ปริมาณ & การไหล 📊**
* ติดตามปริมาณปัจจุบันเทียบกับค่าเฉลี่ย EMA
* เน้นเมื่อกิจกรรมการซื้อขายสูงผิดปกติ
* รวมการวิเคราะห์เดลตาสะสมเพื่อแสดงแรงกดดันการซื้อและการขาย
✅ **การยืนยันเส้นสัญญาณ 📈**
* การคำนวณสัญญาณที่เรียบช่วยระบุการเปลี่ยนแปลงในโมเมนตัมของ KSI
* การแสดงผลฮิสโตแกรมสีเขียว/แดงทำให้การเปลี่ยนแปลงแรงกดดันตลาดอ่านง่าย
## 🕒 ความฉลาดของช่วงเวลาการซื้อขาย
KSI รวมการติดตามช่วงเวลาตลาดโดยอัตโนมัติ:
🌏 ช่วงเวลาตลาดเอเชีย
🇬🇧 ช่วงเวลาตลาดลอนดอน
🇺🇸 ช่วงเวลาตลาดนิวยอร์กตอนเช้า
☕ ช่วงเวลาพักกลางวันนิวยอร์ก
🌆 ช่วงเวลาตลาดนิวยอร์กตอนบ่าย
การแสดง killzone ในตัวช่วยให้ผู้ซื้อขายเข้าใจว่าเมื่อใดที่สภาพคล่องและความผันผวนมักจะสูงขึ้น
## 📌 แผงข้อมูลมืออาชีพ
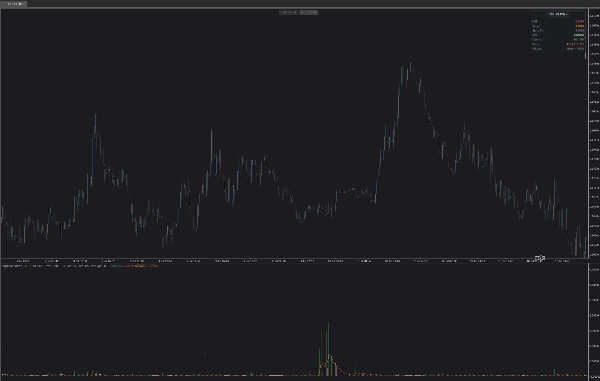
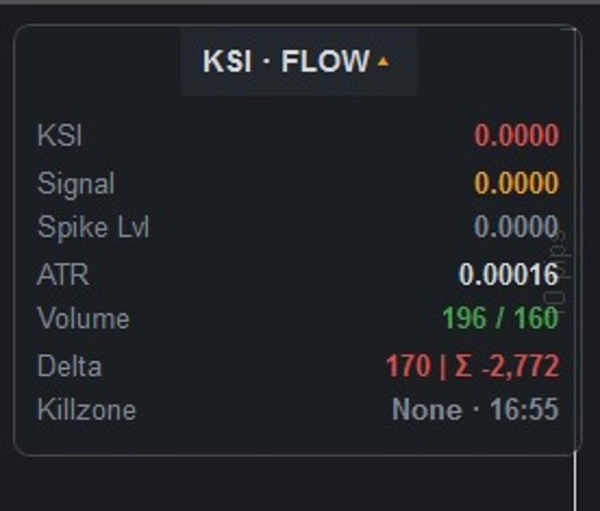
แดชบอร์ดที่รวมอยู่ให้ภาพรวมที่ชัดเจนโดยตรงบนแผนภูมิของคุณ:
📍 ค่าปัจจุบันของ KSI
📍 ระดับสัญญาณ
📍 เกณฑ์สไปค์แบบปรับตัว
📍 การอ่านความผันผวน ATR
📍 ปริมาณปัจจุบันเทียบกับปริมาณเฉลี่ย
📍 เดลต้า & เดลต้าสะสม
📍 ช่วงเวลาการซื้อขายที่ใช้งาน / killzone
แผงสามารถ:
* ✅ วางตำแหน่งได้ในมุมใดก็ได้ของแผนภูมิ
* ✅ ย่อหรือขยายได้
* ✅ ปรับแต่งด้วยความทึบแสงที่กำหนดเองได้
## ⚙️ การตั้งค่าที่ปรับแต่งได้
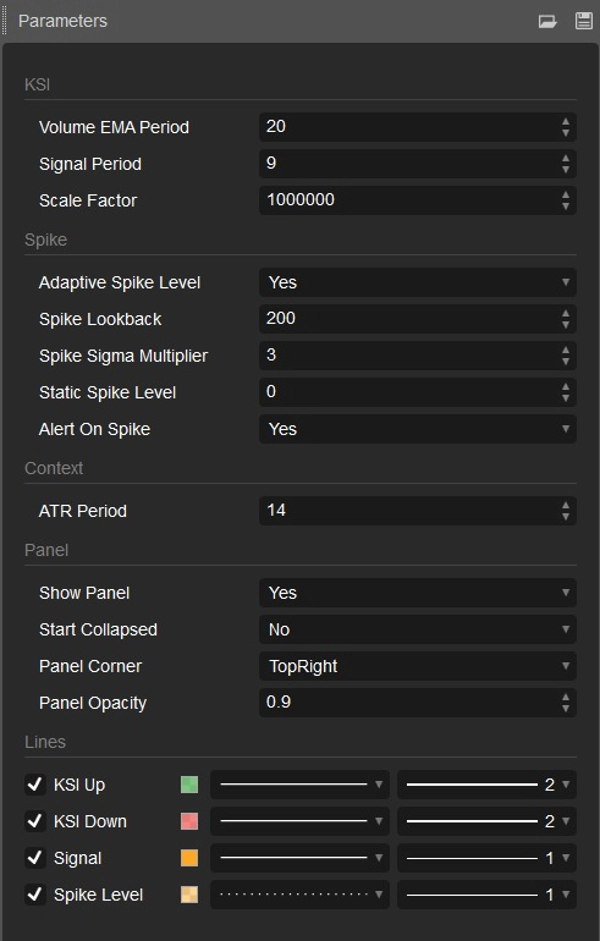
ปรับแต่ง KSI ให้เหมาะกับสไตล์การซื้อขายใดก็ได้:
🔧 ช่วงเวลา EMA ของปริมาณ
🔧 ช่วงเวลาสัญญาณ
🔧 ตัวคูณสเกล
🔧 การตรวจจับสไปค์แบบปรับตัวหรือคงที่
🔧 ช่วงเวลาย้อนหลังของสไปค์
🔧 ตัวคูณความไวของสไปค์
🔧 ช่วงเวลา ATR
🔧 การตั้งค่าลักษณะการแสดงผลของแผง
## 🎯 ออกแบบมาสำหรับ
✔ ผู้ซื้อขายฟอเร็กซ์
✔ ผู้ซื้อขายฟิวเจอร์ส
✔ ผู้ซื้อขายคริปโต
✔ สแคปเปอร์
✔ ผู้ซื้อขายรายวัน
✔ นักวิเคราะห์โครงสร้างตลาด
✔ ผู้ซื้อขายที่มองหาการยืนยันจากปริมาณ
## 💡 วิธีที่ผู้ซื้อขายใช้ KSI
KSI สามารถช่วยระบุ:
⚡ กิจกรรมตลาดที่ผิดปกติ
⚡ แรงกดดันเบรกเอาต์ที่อาจเกิดขึ้น
⚡ ความเบี่ยงเบนของปริมาณ-ราคา
⚡ เหตุการณ์สภาพคล่อง
⚡ การเปลี่ยนแปลงโมเมนตัม
⚡ โอกาสการซื้อขายที่มีความผันผวนสูง
ผสาน KSI กับกลยุทธ์ที่คุณมีอยู่เพื่อให้เห็นภาพที่ชัดเจนขึ้นว่า **เมื่อใดที่ตลาดเคลื่อนไหวตามปกติ — และเมื่อมีสิ่งผิดปกติเกิดขึ้น**
📈 ซื้อขายอย่างชาญฉลาด เข้าใจแรงกดดันตลาด ตรวจจับกิจกรรมที่ซ่อนอยู่ด้วยดัชนีการลื่นไถลเชิงจลน์
สรุป
The indicator includes volume and flow analysis by comparing current volume to its exponential moving average (EMA) and incorporates cumulative delta analysis to visualize buying and selling pressure. A smooth signal line and histogram help confirm changes in KSI momentum, making shifts in market pressure easier to interpret.
KSI tracks major trading sessions—Asia, London, and New York (AM, Lunch, PM)—highlighting periods of higher liquidity and volatility. A professional information panel displays key metrics such as current KSI value, signal level, adaptive spike threshold, ATR volatility, volume comparisons, delta values, and active trading sessions. This panel is customizable in position, size, and opacity.
Settings allow fine-tuning of volume EMA period, signal period, scale factor, spike detection parameters, ATR period, and panel appearance. KSI is suitable for forex, futures, and crypto traders, including scalpers, day traders, and market structure analysts seeking volume-based confirmation and insights into unusual market activity, breakout pressure, liquidity events, and momentum changes.
การสนทนา
รีวิวจากลูกค้า
5 | 0 % | |
4 | 100 % | |
3 | 0 % | |
2 | 0 % | |
1 | 0 % |
คำถามที่พบบ่อย
เพิ่มเติมจากผู้เขียนคนนี้








!["[Hamster-Coder] Bollinger Bands" โลโก้](https://cdn.ctrader.com/image/webp/21d8e5d6-fb11-4bac-b9ee-cd05c2b76804_30327)










ราคา