Descrizione
Indicatori Pinescriptlabs Store: 🤖Pinescriptlabs Store cBots : (cBot)
Gold & BTC BreakoutSession Pivots(nuovo)
SmartTrend Support &
Resistance
Lines
Dynamic
Market Structure
Analysis
of
Turning Points
Fibonacci
Linear
Regression
Multi-timeframe
Multi-Level
Candle Bias
Tracker
Auto
Support and
Resistance
Trend
Lines
All
Support and
Resistance
Levels
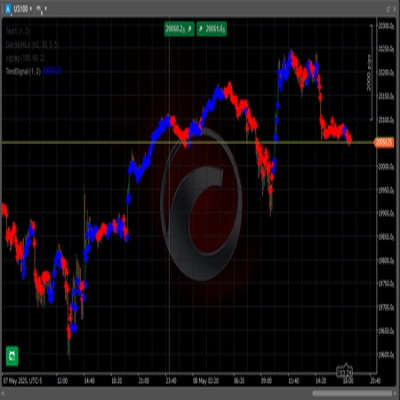
Lo Z-Score trasforma il prezzo in una "scala di
deviazione standard",
mostrando quanto la chiusura di ogni candela (o apertura, massimo, minimo) si discosta dalla sua
media storica. Con una visualizzazione intuitiva, aiuta a identificare condizioni di ipercomprato/ipervenduto
e zone di inversione ad alta probabilità! 🔄
1️⃣ Cosa Fa?
🔹 Standardizza il Prezzo: Converte il valore assoluto di chiusura in un Z-Score—quante deviazioni standard si trova dalla media
degli ultimi N barre.
🔹 Evidenzia
Estremi Statistici: Valori
vicini a ±1, ±2, o ±3 indicano rarità nel movimento del prezzo:
- ±1 SD (≈ 68% probabilità tra –1 e 1)
- ±2 SD (≈ 95% probabilità tra –2 e 2)
- ±3 SD (≈ 99,7% probabilità tra –3 e 3)
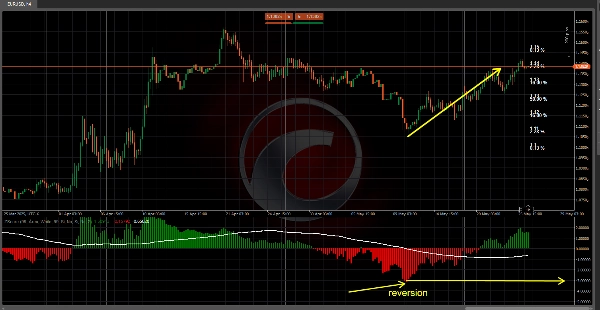
🔹 Aiuta
nel Trading di Ritorno alla Media:
Quando lo Z-Score supera ±2 o ±3, il mercato è in una zona estrema
e tende a ritornare verso la media (zero).
🔹 Visualizzazione
Chiara: Usando istogrammi (o candele speciali), una media mobile
linea e zone colorate, puoi vedere immediatamente se il prezzo si comporta "normalmente" o è un outlier statistico
.
2️⃣ Come Funziona?
📐 Calcolo della Media & Deviazione Standard
- Un
periodo di lookback (es. 99
barre) viene utilizzato. - La media e la deviazione
standard (SD) dei prezzi di chiusura vengono calcolate. - SD più alta = Maggiore volatilità nei movimenti di prezzo.
🧮 Formula dello Z-Score
Z=Close Corrente−Media StoricaDeviazione StandardZ=Deviazione StandardClose Corrente−Media Storica
- Z Positivo → Chiusura sopra la media.
- Z Negativo → Chiusura sotto la media.
📊 Probabilità della Tabella Z
- Evidenzia la
colonna dello Z-Score corrente per mostrare quanto raro/estremo è il prezzo!
3️⃣ Come Usarlo nel Trading
✅ Ritorno alla Media: Cerca Z > +2 o Z < –2 per operare inversioni (vendere estremi ipercomprati
acquistare estremi ipervenduti).
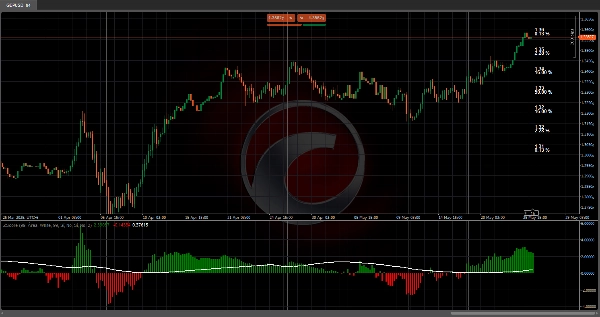
✅ Conferma del Trend: Uno Z
> 0 + media mobile in crescita segnala
forza; Z < 0 + media mobile in calo suggerisce debolezza.
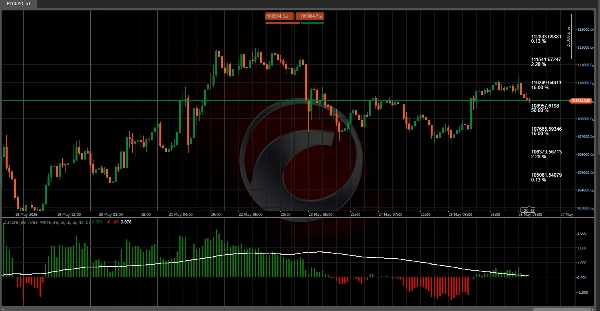
✅ Gestione del Rischio: Vicino a ±1 SD, aspettati movimenti normali; vicino a ±3
SD, regola attentamente stop e
dimensioni delle posizioni.
✅ Tempistica di Entrata: Combina Z-Score estremi con livelli di supporto/resistenza
per entrate precise.
4️⃣ Vantaggi e Considerazioni
✔️ Vantaggi
- Vantaggio statistico nell'individuare condizioni estreme di prezzo.
- Modalità di visualizzazione multiple (istogramma, candele, bande, tabella di probabilità).
- Facile personalizzazione (lunghezza, colori, tipo di grafico).
⚠️ Considerazioni:
- In forti
trend, il prezzo può rimanere
"estremo" per lunghi periodi senza invertire. - Si assume una distribuzione
normale—potrebbe non
funzionare bene in mercati altamente volatili/squilibrati. - Meglio utilizzarlo in ambienti
a volatilità stabile.
Riepilogo
The indicator calculates the mean and standard deviation of recent closing prices to determine the Z-Score using the formula:
Z = (Current Close − Historical Mean) / Standard Deviation.
Positive Z-Scores indicate prices above the mean, while negative scores indicate prices below it.
ZScore Reversion provides clear visualizations through histograms, special candles, moving averages, and colored zones to distinguish normal price behavior from statistical outliers. It supports mean reversion trading by signaling when prices exceed ±2 or ±3 standard deviations, suggesting a likely return to the mean. It also aids trend confirmation by interpreting sustained positive or negative Z-Scores combined with moving average trends.
Risk management is facilitated by adjusting stops and position sizes near extreme Z-Score values. Entry timing can be refined by combining extreme Z-Scores with support and resistance levels. The indicator offers multiple display modes and customization options for length, colors, and chart types. It is best suited for stable volatility environments and assumes a normal distribution of price data.
Recensioni dei clienti
5 | 100 % | |
4 | 0 % | |
3 | 0 % | |
2 | 0 % | |
1 | 0 % |