
คำอธิบาย
ตัวบ่งชี้แนวรับแนวต้านที่ได้รับการปรับปรุง
ปลดล็อกพลังของการวิเคราะห์ทางเทคนิคด้วย ตัวบ่งชี้แนวรับแนวต้านที่ได้รับการปรับปรุง สำหรับ cAlgo เครื่องมือขั้นสูงนี้ถูกออกแบบมาเพื่อช่วยเทรดเดอร์ระบุและแสดงระดับแนวรับและแนวต้านที่สำคัญบนชาร์ตการเทรดของพวกเขา เพิ่มประสิทธิภาพการตัดสินใจและกลยุทธ์การเทรด
คุณสมบัติหลัก:
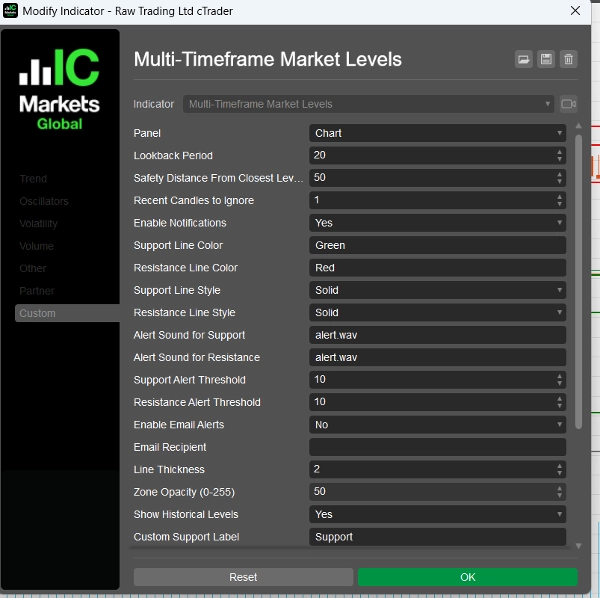
- พารามิเตอร์ที่ปรับแต่งได้: ปรับแต่งตัวบ่งชี้ให้เหมาะกับสไตล์การเทรดของคุณด้วยการตั้งค่าที่ปรับได้ รวมถึงช่วงเวลาย้อนหลัง ระยะห่างความปลอดภัย เสียงแจ้งเตือน และอื่นๆ
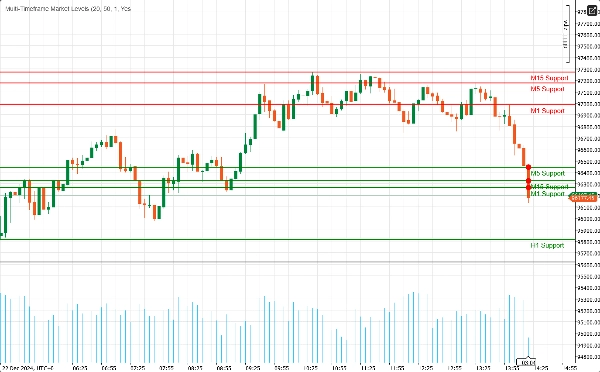
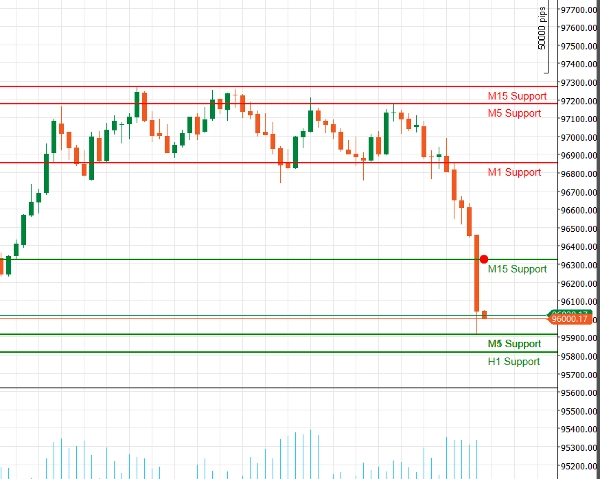
- รองรับหลายกรอบเวลา: วิเคราะห์หลายกรอบเวลาในเวลาเดียวกัน (M1, M5, M15, H1, H4, D1) เพื่อให้ได้ภาพรวมที่ครอบคลุมของพลวัตตลาดและระบุระดับสำคัญในช่วงเวลาการเทรดที่แตกต่างกัน
- แจ้งเตือนแบบเรียลไทม์: รับข้อมูลทันทีด้วยการแจ้งเตือน! ตัวบ่งชี้สามารถส่งเสียงแจ้งเตือนและอีเมลเมื่อราคามาใกล้ระดับแนวรับหรือแนวต้านที่สำคัญ เพื่อให้คุณไม่พลาดโอกาสในการเทรด
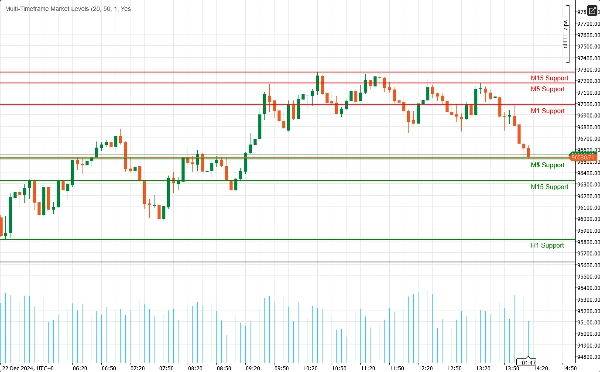
- ความชัดเจนทางภาพ: เพลิดเพลินกับการแสดงผลระดับแนวรับและแนวต้านที่ชัดเจน พร้อมด้วยสีและรูปแบบเส้นที่ปรับแต่งได้ โซนที่เน้นช่วยเพิ่มบริบท ทำให้ง่ายต่อการสังเกตจุดกลับตัวที่เป็นไปได้
- การผสานรวมฟีโบนักชี: เพิ่มประสิทธิภาพการวิเคราะห์ของคุณด้วยการวาดระดับฟีโบนักชีในตัว ช่วยให้คุณระบุระดับการย้อนกลับและการขยายตัวควบคู่กับแนวรับและแนวต้าน
- อินเทอร์เฟซที่ใช้งานง่าย: ออกแบบมาสำหรับทั้งเทรดเดอร์มือใหม่และมืออาชีพ ตัวบ่งชี้ติดตั้งง่ายและผสานรวมได้อย่างราบรื่นกับสภาพแวดล้อม cAlgo ที่คุณมีอยู่
วิธีใช้ตัวบ่งชี้แนวรับแนวต้านที่ได้รับการปรับปรุง
- การติดตั้ง:
-
- ดาวน์โหลดตัวบ่งชี้และนำเข้าไปยังแพลตฟอร์ม cAlgo ของคุณ
- แนบตัวบ่งชี้กับชาร์ตที่คุณต้องการ
- กำหนดค่าพารามิเตอร์:
-
- ปรับการตั้งค่าให้เหมาะกับสไตล์การเทรดของคุณ ตั้งค่าช่วงเวลาย้อนหลัง ระยะห่างความปลอดภัย และเลือกสีและรูปแบบเส้นที่ต้องการสำหรับระดับแนวรับและแนวต้าน
- เปิดใช้งานการแจ้งเตือนหากคุณต้องการรับการแจ้งเตือนเมื่อราคามาใกล้ระดับเหล่านี้
- เลือกกรอบเวลา:
-
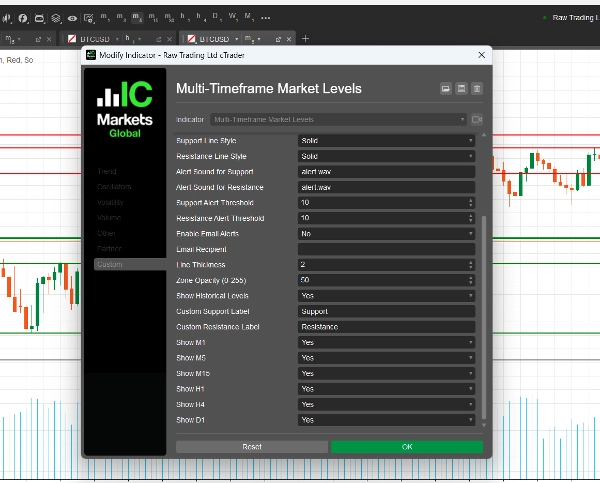
- เลือกกรอบเวลาที่คุณต้องการแสดง คุณสามารถเลือกแสดงหรือซ่อนระดับจาก M1, M5, M15, H1, H4 และ D1 ขึ้นอยู่กับกลยุทธ์การเทรดของคุณ
- วิเคราะห์ชาร์ต:
-
- สังเกตระดับแนวรับและแนวต้านที่วาดบนชาร์ตของคุณ ระดับเหล่านี้แสดงถึงจุดที่ราคามีแนวโน้มจะกลับตัวหรือรวมตัว
วิธีการเทรดด้วยตัวบ่งชี้แนวรับแนวต้านที่ได้รับการปรับปรุง
- การระบุจุดเข้า:
-
- เทรดยาว: มองหาโอกาสซื้อเมื่อราคามาใกล้ระดับแนวรับ โดยเฉพาะอย่างยิ่งถ้ามีสัญญาณการเด้งกลับ (เช่น รูปแบบแท่งเทียนขาขึ้น)
- เทรดสั้น: พิจารณาขายเมื่อราคามาใกล้ระดับแนวต้าน โดยเฉพาะถ้ามีสัญญาณขาลง (เช่น รูปแบบแท่งเทียนขาลง)
- การใช้แจ้งเตือน:
-
- ใช้การแจ้งเตือนแบบเรียลไทม์เพื่อแจ้งเตือนเมื่อราคามาใกล้ระดับแนวรับหรือแนวต้านที่สำคัญ ซึ่งช่วยให้คุณสามารถดำเนินการได้อย่างรวดเร็วและใช้ประโยชน์จากโอกาสการเทรดที่เป็นไปได้
- การผสมผสานกับตัวบ่งชี้อื่นๆ:
-
- เพิ่มประสิทธิภาพกลยุทธ์ของคุณโดยการผสมผสานตัวบ่งชี้แนวรับแนวต้านที่ได้รับการปรับปรุงกับตัวบ่งชี้ทางเทคนิคอื่นๆ (เช่น ค่าเฉลี่ยเคลื่อนที่, RSI, MACD) เพื่อยืนยันสัญญาณและปรับปรุงความแม่นยำของการเทรด
- การตั้งค่าระดับหยุดขาดทุนและทำกำไร:
-
- วางคำสั่งหยุดขาดทุนใต้ระดับแนวรับสำหรับการเทรดยาว และเหนือระดับแนวต้านสำหรับการเทรดสั้นเพื่อจัดการความเสี่ยง
- ตั้งเป้าหมายทำกำไรที่ระดับแนวรับหรือแนวต้านที่สำคัญถัดไปเพื่อเพิ่มผลกำไรที่เป็นไปได้
ทำไมต้องเลือกตัวบ่งชี้แนวรับแนวต้านที่ได้รับการปรับปรุง?
การนำทางผ่านความซับซ้อนของตลาดการเงินอาจเป็นเรื่องท้าทาย ตัวบ่งชี้แนวรับแนวต้านที่ได้รับการปรับปรุง มอบเครื่องมือที่คุณต้องการเพื่อระบุระดับราคาสำคัญและตัดสินใจเทรดอย่างมีข้อมูล ไม่ว่าคุณจะเป็นเทรดเดอร์รายวันหรือผู้ลงทุนระยะยาว ตัวบ่งชี้นี้เป็นส่วนเสริมที่จำเป็นสำหรับชุดเครื่องมือการเทรดของคุณ
สรุป
รีวิวจากลูกค้า
5 | 100 % | |
4 | 0 % | |
3 | 0 % | |
2 | 0 % | |
1 | 0 % |


