คำอธิบาย
🧠 ตัวบ่งชี้ RSI ขั้นสูง – การวิเคราะห์โมเมนตัมที่แม่นยำ
เจาะลึกแนวโน้มตลาดด้วย RSI ที่ชาญฉลาดยิ่งขึ้น
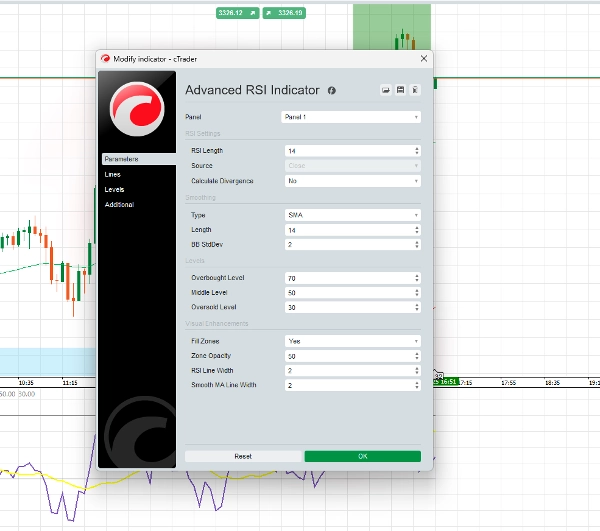
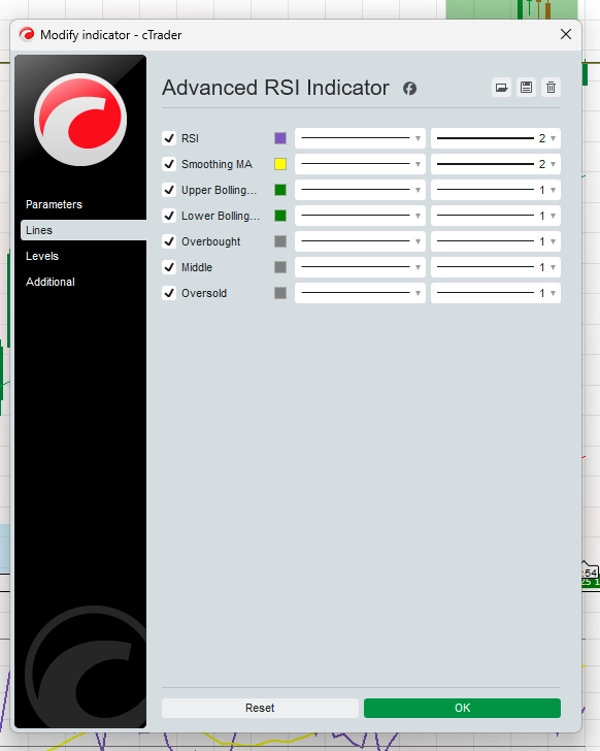
เครื่องมือ Advanced RSI Indicator เป็นวิวัฒนาการที่ทรงพลังของเครื่องมือ RSI คลาสสิก พัฒนาขึ้นสำหรับเทรดเดอร์ที่ให้ความสำคัญกับความแม่นยำและการกรองสัญญาณอย่างชาญฉลาด ด้วยการปรับแต่งอัลกอริทึมขั้นสูง โซนที่ปรับตัวได้ และการตรวจจับความแตกต่างในตัว เครื่องมือนี้ให้การวิเคราะห์โมเมนตัมที่ละเอียดสำหรับทุกตลาดและกรอบเวลา
🔍 คุณสมบัติหลัก:
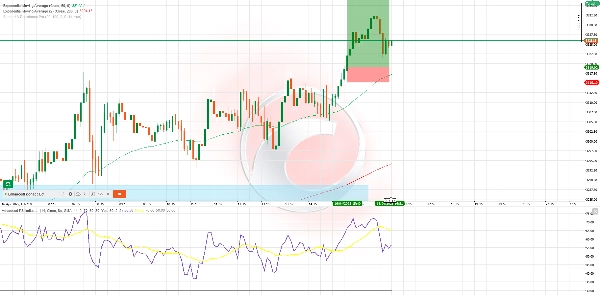
✅ เส้นโค้ง RSI ที่เรียบขึ้น
ลดการเคลื่อนไหวที่สั่นคลอนและสัญญาณเท็จเพื่อให้เห็นภาพแนวโน้มตลาดได้ชัดเจนขึ้น
✅ โซนสัญญาณที่ปรับตัวได้
เกินกว่าระดับ 70/30 แบบดั้งเดิมด้วยเกณฑ์ที่ปรับเปลี่ยนตามความผันผวนของตลาด
✅ โซนโมเมนตัมที่มีสีสัน
ประเมินโมเมนตัมขาขึ้นหรือขาลงได้อย่างรวดเร็วด้วยการออกแบบที่เข้าใจง่าย
✅ การแจ้งเตือนความแตกต่าง
เน้นการตั้งค่าความแตกต่างขาขึ้นและขาลงเพื่อสนับสนุนการตัดสินใจเชิงกลยุทธ์
✅ ระบบแจ้งเตือนที่กำหนดเองได้
ตั้งค่าแจ้งเตือนสำหรับการข้ามระดับ RSI และสัญญาณความแตกต่างเพื่อไม่พลาดช่วงเวลาสำคัญ
✅ รองรับหลายสินทรัพย์ หลายกรอบเวลา
ปรับแต่งสำหรับการใช้งานในฟอเร็กซ์ คริปโต หุ้น ดัชนี และอื่นๆ — ตั้งแต่กราฟ M1 ถึงรายวัน
⚙️ ตัวอย่างกลยุทธ์ – RSI Wave Ride
เหมาะสำหรับ: การเทรดสวิง H1 & H4
ตัวชี้วัดที่ใช้: Advanced RSI, 50 EMA, 200 EMA
ตัวอย่างการซื้อ:
- ราคาสูงกว่า 50 & 200 EMA
- RSI ดิ่งลงต่ำกว่า 40 แล้วเริ่มขึ้น
- สีโมเมนตัมขาขึ้นปรากฏ
- (ไม่บังคับ) ตรวจพบความแตกต่างขาขึ้น
- เข้าเทรด: ปิดแท่งเทียนเหนือสัญญาณ
- SL: ต่ำกว่าจุดต่ำสุดของสวิงล่าสุด
- TP: 1.5x–2x ของความเสี่ยงหรือแนวต้านล่าสุด
ตัวอย่างการขาย:
- ราคาต่ำกว่า 50 & 200 EMA
- RSI เคลื่อนที่สูงกว่า 60 แล้วเริ่มลดลง
- สีโมเมนตัมขาลงยืนยันทิศทาง
- (ไม่บังคับ) ความแตกต่างขาลงเพิ่มความแข็งแกร่ง
- เข้าเทรด: ปิดแท่งเทียนยืนยัน
- SL: สูงกว่าจุดสูงสุดของสวิงล่าสุด
- TP: 1.5x–2x ของความเสี่ยงหรือแนวรับล่าสุด
💬 ทำไมเทรดเดอร์ถึงเลือกเครื่องมือนี้:
- ใช้งานง่ายแต่ทรงพลัง
- สัญญาณไม่รีเพนท์
- ทดสอบในตลาดหลักๆ แล้ว
- ใช้ได้ทั้งแบบเดี่ยวหรือร่วมกับกลยุทธ์อื่นๆ
สรุป
รีวิวจากลูกค้า
5 | 100 % | |
4 | 0 % | |
3 | 0 % | |
2 | 0 % | |
1 | 0 % |