
Açıklama
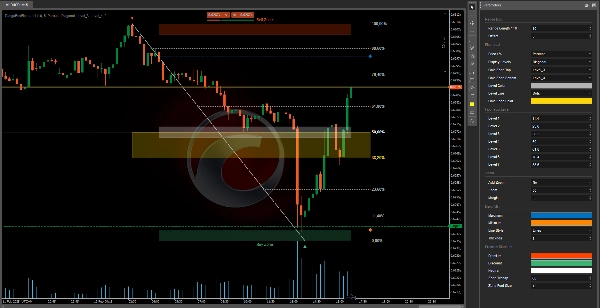
Bu Fibonacci geri çekilme göstergesi, tüccarların piyasa içindeki potansiyel alım ve satım bölgelerini belirlemek için önemli geri çekilme seviyelerini görselleştirmesine ve özelleştirmesine olanak tanır.
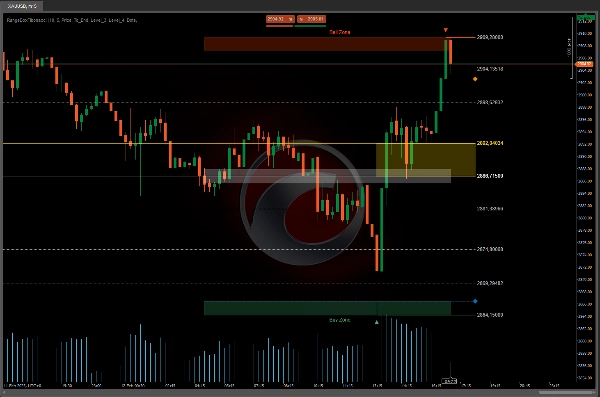
Renkli "Satış Bölgesi" ve "Alım Bölgesi"ne ek olarak, kullanıcılar Fibonacci seviyelerini istedikleri gibi ayarlayabilirler.
Bu gösterge, daha eksiksiz bir ticaret deneyimi için ayrı bir uyarı göstergesi ile tamamlanmıştır.
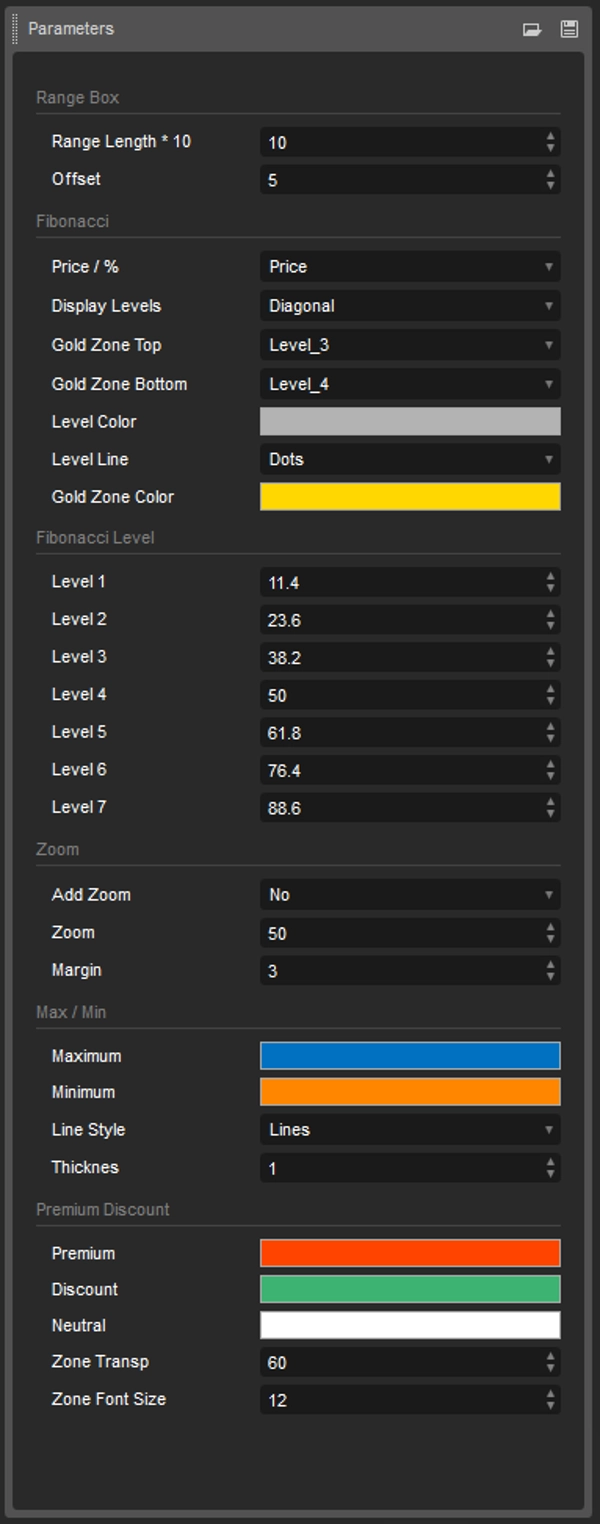
Bu Fibonacci geri çekilme göstergesi ile tüccarlar, grafikte gösterilen geri çekilme seviyeleri üzerinde tam kontrole sahiptir.
Fibonacci seviyelerini özelleştirme yeteneği, renkli bölgeler ve ayrı bir uyarı göstergesi ile birlikte, kullanıcıların aracı bireysel ticaret stratejilerine göre uyarlamasına olanak tanır.
Aşağıdaki araçları dahil ederseniz:
- OrderPrice V3 https://ctrader.com/products/397
- NTMPICLL https://ctrader.com/products/327
- MACDVolume https://ctrader.com/products/267
- MarketSession-MX https://ctrader.com/products/525
Çok para kaybetmenin bir yolu yoktur.
Özet
Müşteri değerlendirmeleri
5 | 50 % | |
4 | 50 % | |
3 | 0 % | |
2 | 0 % | |
1 | 0 % |


