
RT VWAP
Gösterge
2 satın almalar
Sürüm 1.0, Sep 2024
Windows, Mac
Açıklama
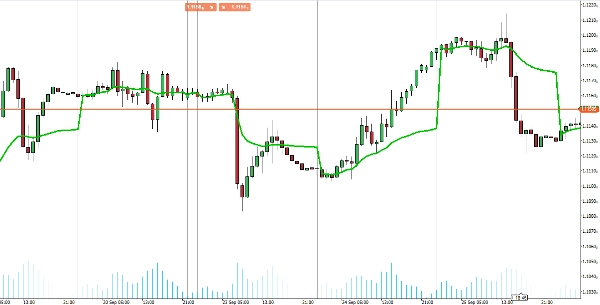
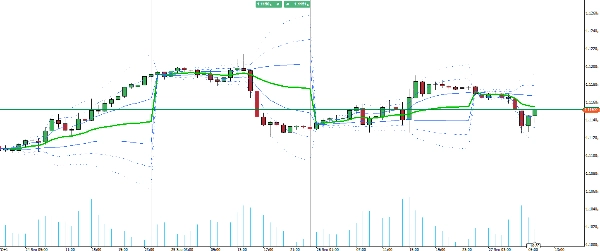
cTrader için VWAP göstergesini tanıtıyoruz, TradingView'in Hacim Ağırlıklı Ortalama Fiyat işlevselliğini ticaret platformunuza getiriyor.
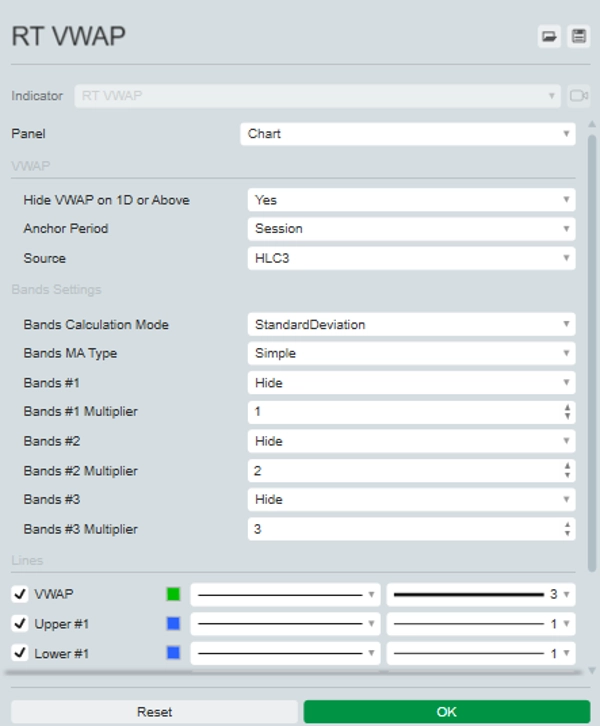
Bu kapsamlı araç, çapa döneminizi (Oturum, Hafta, Ay, Çeyrek, Yıl) seçmenize ve Açılış, Yüksek, Düşük, Kapanış, HL2, HLC3, OHLC4 ve HLCC4 dahil olmak üzere çeşitli fiyat kaynaklarından seçim yapmanıza olanak tanır. Ayrıca, fiyat dağılımının tam bir görünümünü sağlamak için üç standart sapma üst ve alt bantlarını görüntüleyebilir.
VWAP göstergesi, en doğru ve zamanında içgörülere sahip olmanızı sağlamak için gerçek zamanlı olarak tik verileriyle güncellenir. cTrader'da çok yönlü ve güçlü VWAP göstergesi ile ticaret stratejinizi yükseltin.
Özet
Gösterge profili
Müşteri değerlendirmeleri
0.0
Değerlendirmeler: 0
Müşteri değerlendirmeleri
Bu ürün için henüz bir değerlendirme yok. Ürünü denediniz mi? O zaman ona dair görüşlerini paylaşan ilk kişi olun!
Tartışma
SSS
BTCUSD
Forex
Indices
EURUSD
Commodities
GBPUSD
NZDUSD
Scalping
Crypto
Stocks
XAUUSD
NAS100
USDJPY
VWAP
cTrader Store üzerinden erişilebilen işlem botları, göstergeler ve eklentiler gibi ürünler, üçüncü taraf sağlayıcılar tarafından sağlanır ve yalnızca bilgilendirme ve teknik erişim amaçlarıyla sunulur. cTrader Store bir broker değildir ve yatırım tavsiyesi, kişisel öneriler vermez veya gelecekteki performansı garanti etmez.


Fiyat
Başlangıç 25/09/2024
20
Satışlar