
الوصف
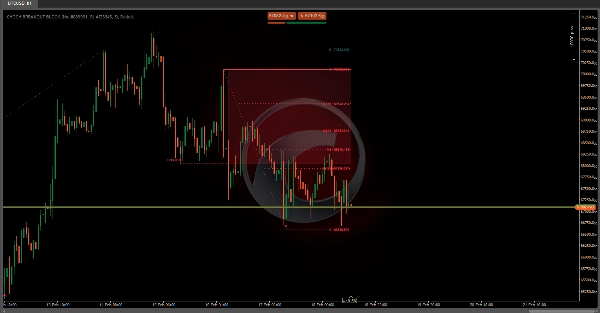
كتلة اختراق CHoCH
https://chartshots.spotware.com/c/69960085a796e
تم تصميم هذا المؤشر للمتداولين الذين يعملون باستخدام حركة السعر و مفاهيم الأموال الذكية (SMC) كمنهجيات. الاستخدام الموصى به:
- 🔍 حدد CHoCH كأول إشارة على احتمال حدوث انعكاس هيكلي.
- 👀 راقب منطقة الاهتمام التي تم إنشاؤها: هي المنطقة التي عادة ما يعود إليها السعر قبل الاستمرار في الاتجاه الجديد.
- ⏳ انتظر حتى يعود السعر إلى المنطقة وبداخلها، ابحث عن التقاء مع مستويات فيبوناتشي (خاصة 0.382، 0.5، 0.618 و 0.786).
- ✅ أكد باستخدام شمعة ابتلاعية (إذا كنت في وضع StructureBased) داخل المنطقة لدخول بدقة أعلى.
- ❌ تصبح الصفقة باطلة إذا انتهك السعر الحد المعاكس للمنطقة، حيث يقوم المؤشر نفسه بإلغاء المنطقة في تلك اللحظة.
https://chartshots.spotware.com/c/699600271b05d
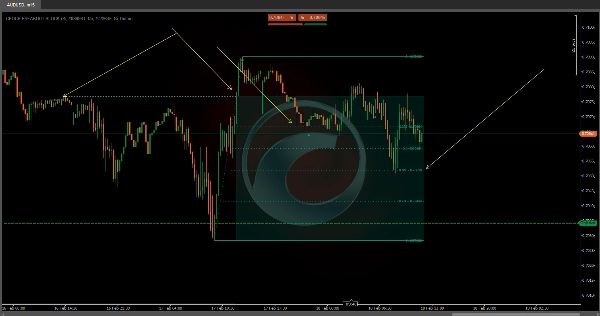
📊 1. تحليل الهيكل ثلاثي الطبقات
يقوم المؤشر بتحليل السوق عبر ثلاث مستويات هرمية متداخلة، من الأقل إلى الأكثر أهمية:
- 🔹 المدى القصير: يكشف عن أعلى وأدنى النقاط المحلية الأخيرة من خلال مقارنة ثلاث شموع متتالية. يتم تأكيد القاع المحلي عندما تكون الشمعة الوسطى أقل من كل من السابقة والتالية. والعكس صحيح بالنسبة للقمة المحلية.
- 🔸 المدى المتوسط: يُبنى على نقاط المدى القصير. عندما تشكل تقلبات المدى القصير نمطًا من القيعان الأدنى أو القمم الأعلى (مما يعني أن ثلاث تقلبات متتالية تؤكد اتجاهًا)، يتم إنشاء نقطة مدى متوسط.
- 🔺 المدى الطويل: يُبنى بنفس الطريقة تمامًا ولكن باستخدام نقاط المدى المتوسط كأساس له. هذه هي الطبقة الأكثر أهمية والتي تُشغل الأحداث الرئيسية للمؤشر.
💡 يضمن هذا الهيكل المتسلسل أن الحركات التي لها وزن هيكلي حقيقي فقط هي التي تولد الإشارات، مع تصفية الضوضاء قصيرة الأجل.
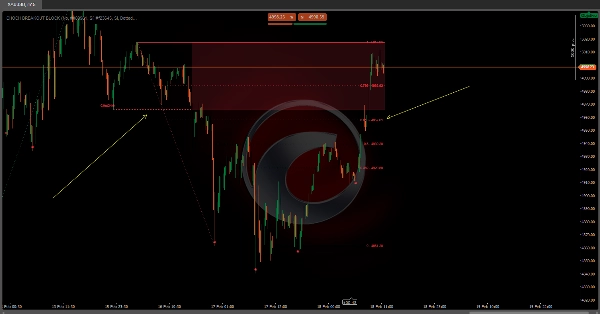
🔄 2. CHoCH — تغيير الشخصية
يُعتبر CHoCH الحدث المركزي للمؤشر. يحدث عندما:
- 🟢 CHoCH صاعد: يغلق السعر فوق أعلى هيكل طويل الأجل سابق، بينما كان اتجاه السوق السابق هابطًا. هذا يشير إلى أن البائعين فقدوا السيطرة وأن السوق قد ينقلب صعودًا.
- 🔴 CHoCH هابط: يغلق السعر دون أدنى هيكل طويل الأجل سابق، بينما كان الاتجاه السابق صاعدًا. هذا يشير إلى أن المشترين فقدوا السيطرة وأن السوق قد ينقلب هبوطًا.
عند اكتشاف CHoCH، يرسم المؤشر:
- ➡️ خطًا أفقيًا عند مستوى الاختراق الدقيق (بالتنسيق والنمط والسمك المُعد).
- 🏷️ تسمية "CHoCH" فوق ذلك الخط.
- 🟥🟩 منطقة اهتمام شبه شفافة
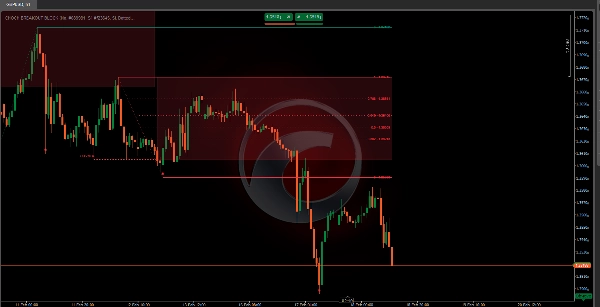
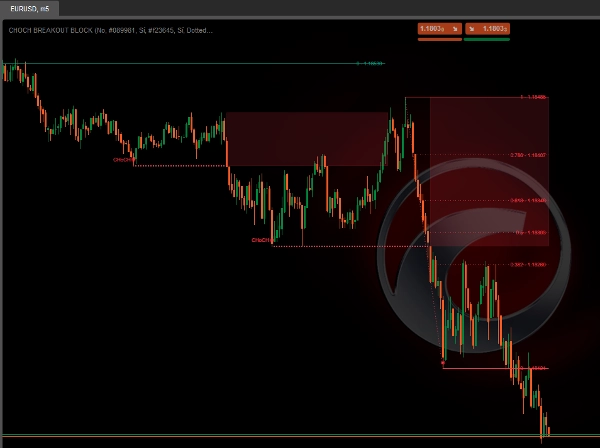
🗺️ 3. منطقة الاهتمام
فور حدوث CHoCH، يقوم المؤشر بتحديد منطقة سعر رئيسية تلقائيًا:
- 🟢 في CHoCH صاعد: تمتد المنطقة من مستوى الاختراق (CHoCH) إلى أدنى نقطة وجدت بين التقلب الهيكلي ولحظة الاختراق. تمثل هذه المنطقة المكان الذي قد يعود إليه السعر للبحث عن السيولة قبل الاستمرار صعودًا.
- 🔴 في CHoCH هابط: تمتد المنطقة من أعلى نقطة وجدت بين التقلب والاختراق إلى مستوى CHoCH. تمثل المنطقة المكان الذي قد يعود إليه السعر للبحث عن السيولة قبل الاستمرار هبوطًا.
تمتد المنطقة تلقائيًا شريطًا بشريط طالما يحترم السعر حدودها. في اللحظة التي ينتهك فيها السعر الحد المعاكس، تتوقف المنطقة عن الامتداد — مما يشير إلى أنها قد تم اختبارها أو إبطالها.
👁️ كما هو موضح في صورة الرسم البياني، تمثل المناطق الحمراء شبه الشفافة هذه مناطق الاهتمام الهبوطية بعد أحداث CHoCH المكتشفة.
📐 4. مستويات فيبوناتشي التلقائية
بعد اكتشاف CHoCH، لا يرسم المؤشر فيبوناتشي على الفور. يظهر فيبوناتشي في مرحلة ثانية، عندما يؤكد السوق أن الاتجاه الجديد له وزن هيكلي حقيقي. يحدث هذا على مرحلتين:
الخطوة 1 — يحدث CHoCH: 🏷️ يتم رسم خط الاختراق، التسمية، ومنطقة الاهتمام. فيبوناتشي غير مرئي بعد.
الخطوة 2 — يشكل السوق تقلبًا طويل الأجل جديدًا في اتجاه CHoCH: 📐 فقط في تلك اللحظة يقوم المؤشر تلقائيًا بإسقاط مستويات فيبوناتشي بين نقطة مرجعية الاختراق وهذا التقلب المؤكد حديثًا.
📌 مثال: في CHoCH صاعد، سيتم رسم فيبوناتشي من أدنى نقطة وجدت أثناء الاختراق إلى أول قمة طويلة الأجل يشكلها السوق بعد ذلك. إذا كان السعر يرتفع لكنه لم يثبت بعد ذلك التقلب الهيكلي، فلن تكون مستويات فيبوناتشي مرئية بعد — وهذا مقصود وليس خطأ.
بمجرد تفعيلها، تمتد المستويات شريطًا بشريط طالما ظل الهيكل صالحًا، ويتم إعادة حسابها تلقائيًا إذا ظهر اختراق هيكلي جديد. المستويات المتاحة هي:
المستوى
المعنى الشائع
0
بداية الحركة
تراجع بسيط
⭐ أول تراجع مهم
0.5
⭐ المستوى المتوسط
⭐ النسبة الذهبية
متغير النسبة الذهبية
⭐ تراجع عميق
1
امتداد 100%
🕯️ 5. كشف شمعة ابتلاعية
يتضمن المؤشر كشف نمط الشمعة الابتلاعية كإشارة تلاقي إضافية:
- ▲ تظهر شمعة ابتلاعية صاعدة عندما تمتص شمعة خضراء كبيرة شمعة حمراء صغيرة سابقة بالكامل.
- ▼ تظهر شمعة ابتلاعية هابطة عندما تمتص شمعة حمراء كبيرة شمعة خضراء صغيرة سابقة بالكامل.
هناك وضعان للعرض:
- 📋 الكل: يعرض كل نمط ابتلاعي يظهر على الرسم البياني.
- 🎯 StructureBased: يعرض فقط الأنماط الابتلاعية التي تحدث داخل منطقة اهتمام نشطة، مما يزيد بشكل كبير من أهمية الإشارة.
الملخص
When a CHoCH occurs, the indicator marks the breakout level with a horizontal line and label, and automatically creates a semi-transparent interest zone where price is likely to return before continuing in the new direction. This zone extends dynamically as long as price respects its boundaries and is invalidated if price breaks the opposite boundary.
The indicator also projects Fibonacci retracement levels automatically after the market confirms the new trend direction by forming a new long-term swing. Supported Fibonacci levels include 0.236, 0.382, 0.5, 0.618, 0.65, 0.786, and 1. Additionally, it detects bullish and bearish engulfing candle patterns as confluence signals, with options to display all patterns or only those occurring within active interest zones for higher precision.
This tool supports multiple markets including BTCUSD, EURUSD, GBPUSD, NZDUSD, XAUUSD, NAS100, and USDJPY.
تقييمات العملاء
5 | 100 % | |
4 | 0 % | |
3 | 0 % | |
2 | 0 % | |
1 | 0 % |


![شعار "[Stellar Strategies] MARSI Signal Plotter"](https://cdn.ctrader.com/image/webp/7b2b8da6-8f8e-4646-8d4a-4710c516c01e_25567)


