
Price Level DWM BT
Wskaźnik
Wersja 1.0, Dec 2025
Windows, Mac
4.7
Opinie: 4
Opis
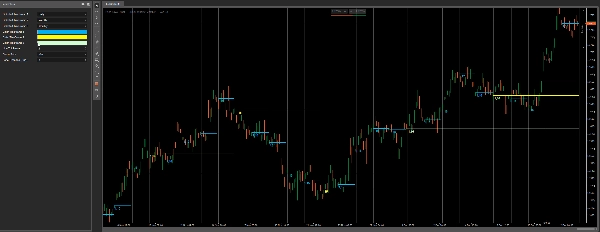
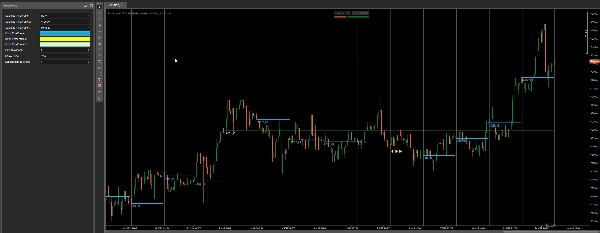
Poziom cenowy DWM od Bullitt Traders
Poziom cenowy DWM Codzienne, tygodniowe i miesięczne poziomy zmiany ceny rysują czyste, odniesione do wyższych ram czasowych poziomy bezpośrednio na twoim wykresie — dzięki czemu zawsze wiesz, gdzie cena stoi względem kluczowych punktów odniesienia dziennych, tygodniowych i miesięcznych.
Te poziomy są szeroko stosowane do:
- kontekstu nastawienia i kierunku
- reakcji wsparcia/oporu w ciągu dnia
- decyzji o powrocie do średniej vs. kontynuacji
- „handel lokalizacyjny” (gdzie cena handluje względem wyższej ramy czasowej)
Utrzymaj swój wykres minimalnym, szybkim i czytelnym, mając jednocześnie kontekst HTF na widoku.
Co otrzymujesz
- Do 3 odniesionych poziomów wyższej ramy czasowej jednocześnie
- Dzienny / Tygodniowy / Miesięczny wybieralne z rozwijanego menu
- Oddzielne kolory dla każdej ramy czasowej
- Regulowana grubość
- Opcjonalna etykieta ceny (czysta i dyskretna)
Kluczowe cechy
- Minimalistyczne rysowanie poziomów HTF (zapewnione dla czystych wykresów)
- Nieprzemalowujące się poziomy odniesienia (oparte na zakończonych danych HTF)
- Świetnie współpracuje z sesjami, strefami S&D, strukturą rynku, narzędziami ICT i innymi
- Odpowiedni dla FX, indeksów, złota — dowolnego rynku
Ustawienia
- Wybierz Ramę Czasową 1 / 2 / 3
- Kolor dla każdej ramy czasowej
- Grubość linii
- Pokaż etykietę ceny (włącz/wyłącz)
- Odległość etykiety (wizualne przesunięcie)
Uwagi
- Używa zakończonych danych wyższej ramy czasowej, aby utrzymać poziomy stabilne i spójne.
Podsumowanie
Profil wskaźnika
Kategoria wskaźnika
Zmienność
Typ wyjścia
Sygnały
Wymagania dotyczące danych
Dane zewnętrzne
Obsługiwane sygnały
Przebicie poziomu
Opinie klientów
4.7
Opinie: 4
5 | 75 % | |
4 | 25 % | |
3 | 0 % | |
2 | 0 % | |
1 | 0 % |
Opinie klientów
February 9, 2026
Price Level DWM BT provides clean and accurate daily, weekly and monthly levels. Best used from M5 and higher timeframes, where levels stay readable and meaningful. A great context tool for intraday and swing traders who rely on higher-TF structure, reactions and trade planning.
December 18, 2025
The setup needs less second guessing, but overconfidence is the real danger.
December 15, 2025
pretty fine as one more layer, especially in mixed charts. A few signals across sessions tell more.
Dyskusja
Częste pytania
Prop
Forex
Signal
Breakout
Scalping
Commodities
Crypto
Produkty dostępne za pośrednictwem cTrader Store, w tym boty handlowe, wskaźniki i wtyczki, dostarczane są przez deweloperów zewnętrznych i udostępniane wyłącznie w celach informacyjnych oraz w celu zapewnienia dostępu technicznego. cTrader Store nie jest brokerem i nie zapewnia doradztwa inwestycyjnego, nie udziela spersonalizowanych rekomendacji ani nie gwarantuje przyszłych wyników.


![Logo „[Hamster-Coder] Moving Average MTF”](https://cdn.ctrader.com/image/webp/b11b98b1-194d-4b8e-b00e-d611826ad159_31226)


Cena
48
Sprzedaż
1.07K
Bezpłatne instalacje