
LT_Ind_TradeNet
Wskaźnik
1 zakupy
Wersja 1.0, Oct 2025
Windows, Mac
5.0
Opinie: 1
Opis
Uwaga: Testowano tylko na cTrader Windows.
LT_Ind_TradeNet to skoncentrowany wskaźnik śledzący zyski dla jednego symbolu handlowego.
Pomaga traderom zachować dyscyplinę, pokazując, ile zarobili w bieżącym dniu, tygodniu i miesiącu — podzielone na wyraźne stany transakcji.
Stany
- NoTrade – brak otwartej pozycji
- Fresh – nowe transakcje w kierunku dziennego celu
- Manage – zarządzanie istniejącymi lub nakładającymi się transakcjami
- Leftover – pozostałe transakcje po osiągnięciu celu lub zakończeniu sesji
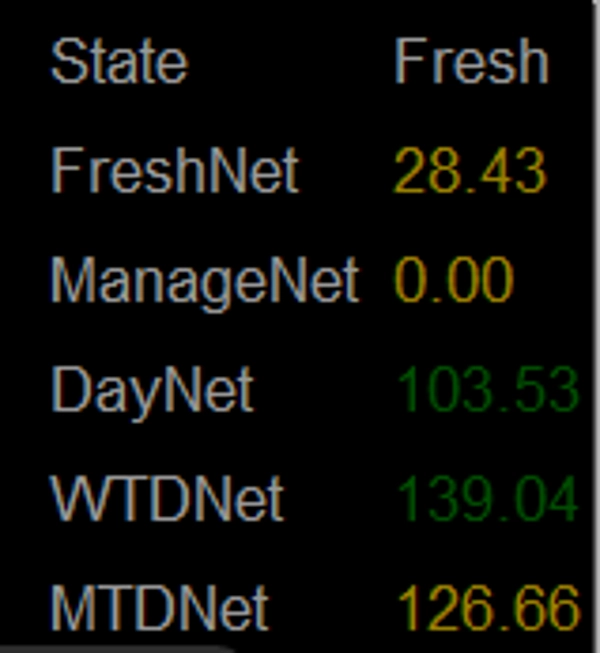
Wyświetlane metryki
- FreshNet – zysk netto z transakcji jednostronnych
- ManageNet – zysk netto ze wszystkich nakładających się transakcji (obie strony)
- DayNet – całkowity zysk za bieżący dzień
- WTDNet – zysk od początku tygodnia
- MTDNet – zysk od początku miesiąca
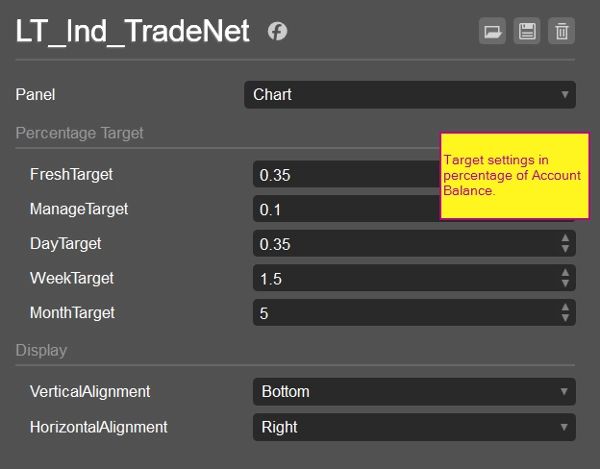
Cel
- Utrzymuje traderów skoncentrowanych na realistycznych celach dziennych lub tygodniowych
- Zmniejsza emocjonalne i chciwe zachowania poprzez określenie jasnego punktu „dość”
- Zapewnia prostą informację zwrotną, aby zdecydować, czy kontynuować handel, czy zakończyć sesję
Najważniejsze cechy
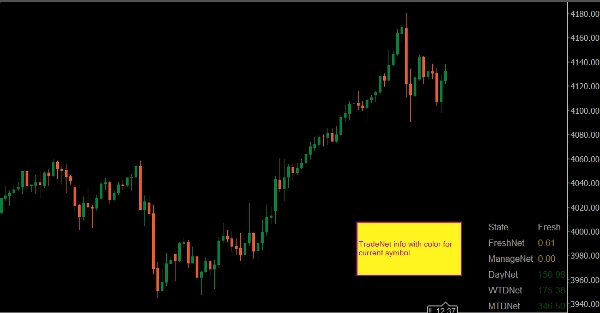
- Specyficzny dla symbolu: każdy wykres pokazuje swoją własną wydajność
- Lekki i nieinwazyjny
- Idealny dla traderów na żywo, którzy realizują strukturalne dzienne/tygodniowe cele zysku
Podstawowa zasada:
Wystarczająco to klucz do zwycięstwa.
Podsumowanie
Profil wskaźnika
Opinie klientów
5.0
Opinie: 1
5 | 100 % | |
4 | 0 % | |
3 | 0 % | |
2 | 0 % | |
1 | 0 % |
Dyskusja
Częste pytania
Prop
Forex
Indices
Commodities
Crypto
Stocks
Produkty dostępne za pośrednictwem cTrader Store, w tym boty handlowe, wskaźniki i wtyczki, dostarczane są przez deweloperów zewnętrznych i udostępniane wyłącznie w celach informacyjnych oraz w celu zapewnienia dostępu technicznego. cTrader Store nie jest brokerem i nie zapewnia doradztwa inwestycyjnego, nie udziela spersonalizowanych rekomendacji ani nie gwarantuje przyszłych wyników.


Cena
Od 25/09/2024
34
Sprzedaż