

Opis
SWING VOLUME PROFILE (SVP)
Profil wolumenu oparty na swingach + Fibonacci + RSI
--------------------------------------------------
Wykrywanie swingów. Profil wolumenu. Fibonacci. RSI. Wszystko w jednym.
--------------------------------------------------
CO ROBI TEN WSKAŹNIK
Swing Volume Profile (SVP) automatycznie wykrywa strukturalne swingi i wyświetla profil wolumenu dla ostatniego zakończonego swingu — z nakładką poziomów Fibonacciego i RSI.
Nie jest potrzebny ręczny wybór zakresu. Wskaźnik sam znajduje swingi i buduje profil.
--------------------------------------------------
KLUCZOWE CECHY
- AUTOMATYCZNE WYKRYWANIE SWINGÓW (konfigurowalna głębokość i odchylenie)
- Profil wolumenu dla ostatniego zakończonego swingu
- Punkt Kontroli (POC) - najwyższy poziom wolumenu
- Obszar wartości (VAH + VAL) - konfigurowalny procent
- Węzły wysokiego wolumenu (HVN) - wolumen powyżej średniego progu
- Poziomy Fibonacciego (0, 23.6, 38.2, 50, 61.8, 78.6, 100)
- Nakładka RSI blisko aktualnej ceny
- Pozycjonowanie histogramu: Lewo, Prawo lub Blisko świec
- Konfigurowalna liczba wierszy (10 do 200)
- Możliwość dostosowania kolorów i przezroczystości
- Rozciąganie linii w prawo
- Pokazywanie/ukrywanie etykiet cenowych
- Brak przemalowywania
--------------------------------------------------
JAK TO DZIAŁA
1. Wskaźnik wykrywa swingi używając konfigurowalnej głębokości i odchylenia
2. Identyfikowany jest ostatni zakończony swing
3. Profil wolumenu jest obliczany na podstawie zakresu swingu
4. Wyświetlane są POC, VAH, VAL, HVN
5. Nakładany jest poziom Fibonacciego na swing
6. Aktualny RSI jest wyświetlany blisko ceny
Wszystko automatycznie. Bez potrzeby ręcznego wprowadzania danych.
--------------------------------------------------
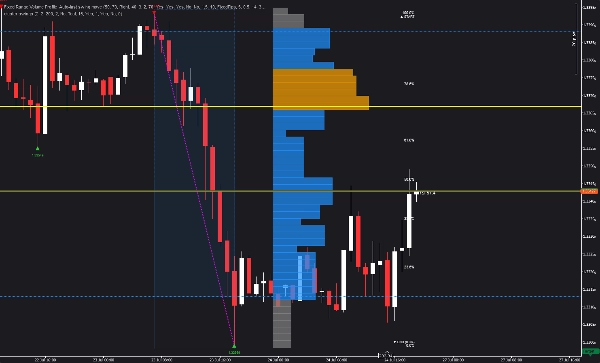
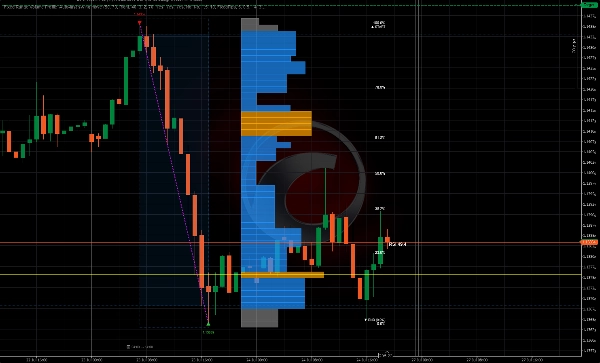
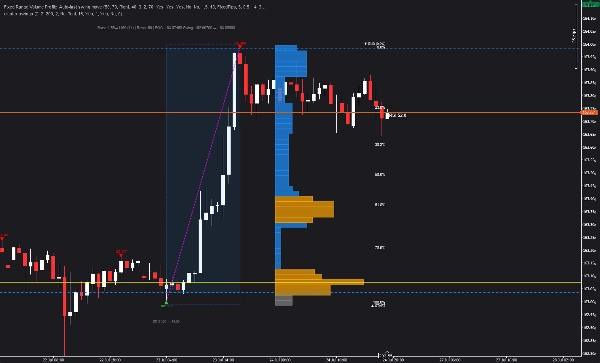
ELEMENTY WIZUALNE
- Czerwone trójkąty w dół = Maksima swingów
- Zielone trójkąty w górę = Minima swingów
- Fioletowa linia przerywana = Połączenie swingów
- Żółta linia pozioma = Punkt Kontroli (POC)
- Niebieskie linie przerywane = Wysoki Obszar Wartości (VAH) i Niski Obszar Wartości (VAL)
- Pomarańczowe słupki = Węzły wysokiego wolumenu (HVN)
- Szare słupki = Węzły niskiego wolumenu
- Złote linie poziome = Poziomy Fibonacciego
- Białe etykiety = Procenty Fibonacciego
- Wartość RSI = Aktualny RSI blisko ceny
--------------------------------------------------
PRZEGLĄD PARAMETRÓW
USTAWIENIA PROFILU:
- Liczba wierszy: Ile wierszy cenowych (10-200)
- Procent obszaru wartości: % wolumenu w obszarze wartości (1-100)
USTAWIENIA WIZUALNE:
- Pozycja histogramu: Prawo, Lewo, Blisko świec lub Blisko świec po lewej
- Szerokość histogramu %: Szerokość słupków histogramu
- Skalowanie szerokości słupków
- Minimalna szerokość słupka %
- Przezroczystość słupków (10-100)
WYKRYWANIE SWINGÓW:
- Głębokość swingu: Ile słupków do sprawdzenia lokalnych ekstremów
- Tryb odchylenia: Stałe pipsy lub oparte na ATR
- Stałe odchylenie: Minimalna odległość w pipsach między swingami
- Mnożnik odchylenia ATR: Mnożnik dla odchylenia opartego na ATR
- Okres ATR: Okres do obliczania ATR
- Backstep: Minimalna liczba słupków między swingami
WIZUALIZACJA - SWINGI:
- Pokaż linie swingów: Przełącz linię swingów w kolorze magenta
- Kolor linii swingów
- Pokaż etykiety swingów: Przełącz etykiety cenowe
- Kolory swingów wysokich/niskich
WIZUALIZACJA - FIBONACCI:
- Pokaż poziomy Fib: Przełącz nakładkę Fibonacciego
- Pokaż linie Fib: Przełącz linie poziome
- Pokaż etykiety Fib: Przełącz etykiety procentowe
- Kolor linii Fib / Kolor tekstu Fib
WIZUALIZACJA - RSI:
- Pokaż wartość RSI: Przełącz nakładkę RSI
- Okres RSI: Okres do obliczania RSI
- Kolor etykiety RSI
KOLORY:
- Kolor POC / Kolor obszaru wartości / Kolor węzła wysokiego wolumenu / Kolor niskiego wolumenu
--------------------------------------------------
ZASTOSOWANIA
- Identyfikacja swingów i rozkładu wolumenu w jednym widoku
- Znajdowanie Punktu Kontroli (POC) dla wejść i wyjść
- Używanie obszaru wartości (VAH/VAL) jako celów zysku
- Wykrywanie węzłów wysokiego wolumenu (HVN) dla kluczowych poziomów
- Nakładanie poziomów Fibonacciego na swing
- Potwierdzanie transakcji zbieżnością RSI
- Szybkie zrozumienie rozkładu wolumenu
--------------------------------------------------
AKTUALIZACJA DO STRUCTURAL HEAT ZONES
Ten wskaźnik pokazuje swingi i rozkład wolumenu.
Structural Heat Zones idzie dalej — mapuje intensywność uczestnictwa, akceptację vs odrzucenie oraz zaangażowanie rynku w wielu strefach.
Szukaj Structural Heat Zones w sklepie cTrader.
--------------------------------------------------
AKTUALIZACJA DO INVICTUS EA
Invictus EA wykorzystuje technologię strukturalną do wykonywania automatycznych transakcji.
Szukaj Invictus w sklepie cTrader.
--------------------------------------------------
NOTATKI TECHNICZNE
- Wskaźnik nakładkowy
- Działa na dowolnym interwale i symbolu
- Brak przemalowywania (obliczenia historyczne)
- Optymalizacja pod kątem wydajności
--------------------------------------------------
WSPARCIE
Aktualizacje dożywotnie w cenie.
DLA WIĘCEJ INFORMACJI - Kliknij profil dewelopera poniżej.
Podsumowanie
The indicator identifies swings using configurable parameters such as swing depth and deviation mode (fixed pips or ATR-based), then computes volume distribution within the swing range without requiring manual range selection. Visual elements include colored markers for swing highs and lows, volume nodes, Fibonacci levels, and RSI values, all customizable in terms of color, opacity, and histogram positioning.
Key features include no repainting, configurable rows for volume profile resolution, extendable lines, and toggleable price labels. Use cases focus on identifying swing structures, volume distribution, key price levels, and confluences for trade entries, exits, and profit targets. The indicator is optimized for performance and provides lifetime updates.




























