
Volume Meter
Wskaźnik
2 zakupy
Wersja 1.0, Sep 2025
Windows, Mac
5.0
Opinie: 1
Od 29/05/2025
3.04M
Wolumen transakcji
45.22K
Zysk w pipsach
29
Sprzedaż
768
Bezpłatne instalacje
Opis
📘 Co robi ten wskaźnik
- Pokazuje wolumen ticków (liczbę zmian ceny na świecę) w formie histogramu.
- Na rynku Forex brokerzy rzadko udostępniają rzeczywisty wolumen obrotu, dlatego wolumen ticków jest używany jako przybliżenie.
- Na rynku akcji/CFD/kontraktów terminowych można uzyskać rzeczywisty wolumen.
- Nakłada średnią kroczącą wolumenu (domyślnie 20-okresową).
- Działa to jako „linia bazowa”, pozwalająca szybko zauważyć, czy wolumen bieżącej świecy jest nietypowo wysoki lub niski.
🎯 Jak używać jako potwierdzenie
Wskaźnik nie jest samodzielnym generatorem sygnałów. Zamiast tego traderzy używają go do potwierdzania setupów z innych strategii:
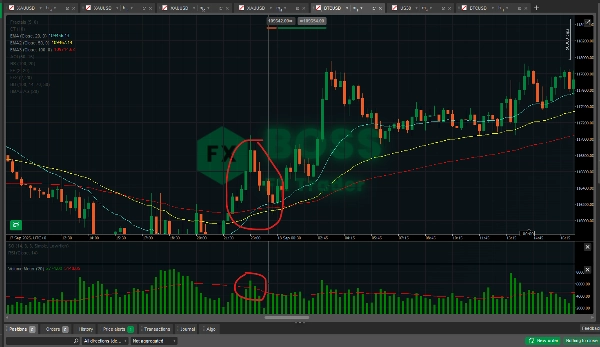
- Potwierdzenie wybicia
-
- Jeśli cena przebija opór lub wsparcie, sprawdź, czy świeca wybicia ma wolumen powyżej swojej średniej kroczącej.
- Wysoki wolumen potwierdza większą liczbę uczestników ruchu → wybicie jest bardziej wiarygodne.
- Wybicie przy niskim wolumenie = większe prawdopodobieństwo fałszywego wybicia.
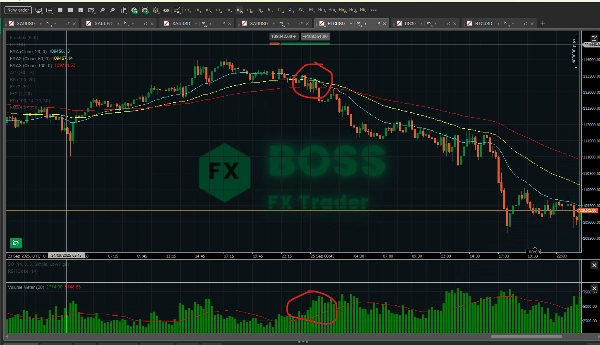
- Kontynuacja trendu vs. wyczerpanie
-
- W silnym trendzie świece korekcyjne często mają niższy wolumen w porównaniu do świec impulsowych.
- Jeśli korekta następuje przy niskim wolumenie, a następny ruch wznowi się z wyższym wolumenem → potwierdza kontynuację trendu.
- Jeśli widzisz kontynuację ruchu trendowego, ale wolumen spada przy każdym impulsie → możliwe wyczerpanie, przygotuj się na odwrócenie.
- Potwierdzenie odwrócenia
-
- Duże świece odwracające (pin bary, świece pochłaniające, fraktale) są silniejsze, jeśli poparte są skokiem wolumenu.
- Przykład: byczy pin bar przy wsparciu z wysokim wolumenem = silniejszy sygnał odwrócenia niż ten sam pin bar przy niskim wolumenie.
- Filtr fałszywych sygnałów
-
- Jeśli twój główny system generuje sygnał kupna/sprzedaży, ale wolumen jest słaby (poniżej średniej), możesz zdecydować się nie realizować tego zlecenia.
- Pomaga to ograniczyć nadmierne handlowanie i filtrować szumy.
📊 Skuteczność
- Na rynku Forex: Wolumen ticków wykazuje silną korelację z rzeczywistym wolumenem obrotu (70–90% korelacji w wielu badaniach). Jest więc użyteczny, ale nie doskonały.
- Na rynku akcji/kontraktów terminowych/CFD: Rzeczywisty wolumen czyni go znacznie potężniejszym, ponieważ mierzy faktycznie zawarte kontrakty/akcje.
- Jako potwierdzenie: Najlepiej używać w połączeniu z analizą cen i innymi wskaźnikami (np. EMA, RSI, fraktale). Poleganie wyłącznie na wolumenie jest ryzykowne.
- Mocne strony: Potwierdza wybicia, filtruje fałszywe ruchy, wykrywa wyczerpanie.
- Słabości: Sam nie przewiduje kierunku — dodaje pewności dopiero przy istniejącym setupie.
✅ Praktyczna wskazówka:
Używaj wskaźnika jako filtra, a nie wyzwalacza. Na przykład:
- Widzisz przecięcie EMA (sygnał kupna).
- Sprawdź: Czy wolumen jest powyżej swojej średniej kroczącej? Jeśli tak → wykonaj transakcję. Jeśli nie → poczekaj.
W ten sposób handlujesz tylko wtedy, gdy momentum jest poparte udziałem rynku.
Podsumowanie
Podsumowanie AI
Volume Meter is a trading indicator that displays tick volume—the number of price changes per bar—as a histogram. In Forex markets, where real traded volume data is often unavailable, tick volume serves as a proxy, while in stocks, CFDs, and futures, real volume data may be used. The indicator overlays a moving average of volume (default 20-period) to provide a baseline, helping traders identify whether current volume is unusually high or low.
This tool is designed to confirm trading setups rather than generate standalone signals. It assists in validating breakouts by checking if breakout candles have volume above their moving average, indicating stronger market participation. It also helps distinguish trend continuation from exhaustion by comparing volume levels during pullbacks and impulse moves. Additionally, it supports reversal confirmation by highlighting volume spikes on significant reversal candles and filters false signals by advising caution when volume is weak despite buy or sell signals from other systems.
Volume Meter is applicable across various markets including Forex, stocks, indices, commodities, and cryptocurrencies. Its effectiveness is enhanced when combined with price action and other indicators such as EMA or RSI. The indicator aids in improving trade decision confidence by integrating volume analysis as a confirmation and filtering tool.
Profil wskaźnika
Opinie klientów
5.0
Opinie: 1
5 | 100 % | |
4 | 0 % | |
3 | 0 % | |
2 | 0 % | |
1 | 0 % |
Opinie klientów
October 1, 2025
the first 10 trades should stay boring, and the checklist becomes easier to follow.
Dyskusja
Częste pytania
BTCUSD
Forex
Breakout
Indices
EURUSD
Commodities
GBPUSD
NZDUSD
Prop
Supertrend
Crypto
Stocks
XAUUSD
NAS100
USDJPY
Produkty dostępne za pośrednictwem cTrader Store, w tym boty handlowe, wskaźniki i wtyczki, dostarczane są przez deweloperów zewnętrznych i udostępniane wyłącznie w celach informacyjnych oraz w celu zapewnienia dostępu technicznego. cTrader Store nie jest brokerem i nie zapewnia doradztwa inwestycyjnego, nie udziela spersonalizowanych rekomendacji ani nie gwarantuje przyszłych wyników.


Cena
Od 29/05/2025
3.04M
Wolumen transakcji
45.22K
Zysk w pipsach
29
Sprzedaż
768
Bezpłatne instalacje