
Opis
✅ Płynna linia trendu zmieniająca kolor, która natychmiast dostosowuje się do kierunku
✅ Opcjonalne strzałki w górę i w dół dla wyraźnych sygnałów zmiany trendu
✅ Filtruje szumy, aby podkreślić czyste, wiarygodne przejścia trendu
✅ Idealna do podążania za trendem, korekt i odwróceń
✅ W pełni konfigurowalna: okres, czułość i wyświetlanie strzałek
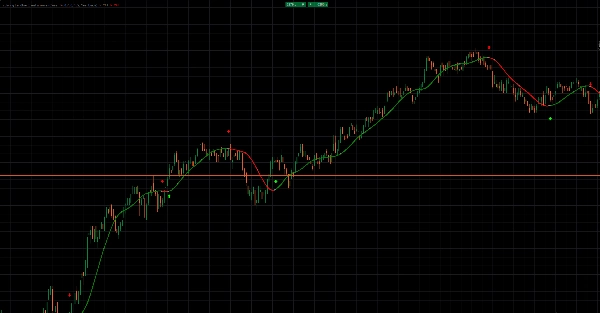
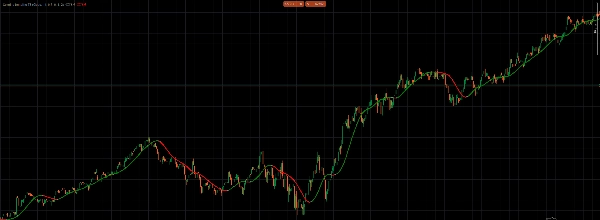
Linia Coloring Trendline with Arrows zapewnia płynny, responsywny obraz kierunku rynku bez zbędnego bałaganu.
Linia trendu dynamicznie zmienia się na zielono w fazach wzrostowych i na czerwono w fazach spadkowych, co sprawia, że kierunek trendu jest natychmiast czytelny.
Gdy momentum się odwraca, opcjonalne strzałki oznaczają zmianę — zielone strzałki dla trendów wzrostowych, czerwone strzałki dla trendów spadkowych.
Pozwala to na wczesne wychwycenie punktów zwrotnych trendu, unikając fałszywych sygnałów spowodowanych szumem rynkowym.
Zaprojketowana z myślą o przejrzystości, płynnie dostosowuje się do ceny, zachowując silną strukturę kierunkową.
Idealna do wyznaczania momentów wejścia, zarządzania wyjściami i pozostawania w zgodzie z dominującym trendem.
Używaj jej jako samodzielnego narzędzia trendowego lub łącz z istniejącą strategią dla dodatkowego potwierdzenia.
Czysta wizualizacja. Jasne sygnały. Pewne handlowanie trendem.
Podsumowanie
Opinie klientów
5 | 0 % | |
4 | 100 % | |
3 | 0 % | |
2 | 0 % | |
1 | 0 % |


