
Opis
SR Commander
Bezpłatna wersja próbna Big Brother: SR Commander Multi Timeframe https://ctrader.com/products/3833?u=ALGO-XL
SR Commander to czysty i inteligentny wskaźnik wsparcia i oporu dla cTrader, stworzony, aby pomóc traderom zidentyfikować kluczowe poziomy rynkowe, natychmiast odczytać pozycję ceny i szybciej reagować na scenariusze wybicia, przebicia i odrzutu.
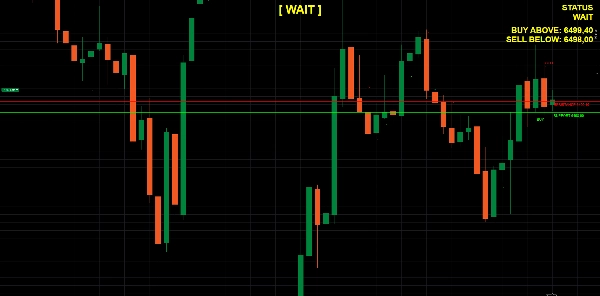
Zamiast zaśmiecać wykres niepotrzebnym szumem, SR Commander skupia się na tym, co najważniejsze: najbliższych możliwych do działania poziomach wsparcia i oporów wokół bieżącej ceny, połączonych z prostym wizualnym systemem statusu, który informuje, czy rynek znajduje się w stanie KUPNA, SPRZEDAŻY lub OCZEKIWANIA.
Dzięki temu jest szczególnie przydatny dla traderów, którzy chcą mieć szybki, uporządkowany obraz zachowania rynku bez konieczności ręcznego oznaczania poziomów na każdym wykresie.
Jak działa SR Commander
SR Commander skanuje ostatnie ruchy cenowe i identyfikuje najważniejsze świece w ramach wybranej logiki cofania. Łączy to z obliczeniami opartymi na zmienności, aby zbudować znaczące poziomy wsparcia i oporu wokół bieżącej ceny rynkowej.
Z wykrytych poziomów wskaźnik automatycznie wybiera najbliższe wsparcie poniżej ceny oraz najbliższy opór powyżej ceny. Poziomy te są następnie rysowane bezpośrednio na wykresie jako wyraźne linie poziome, dając natychmiastowe zrozumienie, gdzie cena aktualnie znajduje się w strukturze rynku.
Po ustaleniu tych poziomów SR Commander ocenia aktualną sytuację rynkową:
- KUPNO / WYBICIE
Jeśli cena zamknie się powyżej najbliższego poziomu oporu, z regulowanym buforem wybicia, wskaźnik interpretuje to jako wybicie wzrostowe. - SPRZEDAŻ / PRZEBICIE
Jeśli cena zamknie się poniżej najbliższego poziomu wsparcia, z regulowanym progiem przebicia, wskaźnik interpretuje to jako przebicie spadkowe. - OCZEKIWANIE
Jeśli cena pozostaje pomiędzy wsparciem a oporem, wskaźnik sygnalizuje, że rynek nadal znajduje się w zakresie i nie nastąpiło wyraźne wybicie kierunkowe.
Ta logika pomaga traderom unikać emocjonalnego podejmowania decyzji i zapewnia bardziej obiektywne ramy do odczytu struktury rynku.
Stworzony do podejmowania decyzji na rzeczywistych wykresach
SR Commander to nie tylko rysowanie linii. Został zaprojektowany, aby pomóc traderom zrozumieć, co cena robi na tych liniach.
Oprócz wykrywania warunków wybicia i przebicia, wskaźnik może również identyfikować:
- Sygnały odbicia kupna gdy cena testuje wsparcie i zamyka się powyżej niego z potwierdzeniem wzrostowym
- Sygnały odrzutu sprzedaży gdy cena testuje opór i zamyka się poniżej niego z potwierdzeniem spadkowym
- Historyczne znaczniki wybicia i przebicia dzięki czemu poprzednie reakcje rynku można przeglądać bezpośrednio na wykresie
- Opcjonalne historyczne punkty reakcji kupna i sprzedaży dla traderów, którzy chcą badać przeszłe zachowanie wsparcia/oporu
Dzięki temu SR Commander jest przydatny nie tylko do analizy na żywo, ale także do przeglądu wykresów, rozpoznawania wzorców i prowadzenia dziennika transakcji.
Czysta struktura wizualna
Jedną z zalet SR Commander jest jego prostota. Wskaźnik został zaprojektowany tak, aby pozostać wizualnie czytelny, jednocześnie dostarczając kluczowych informacji.
Może wyświetlać:
- Najbliższe poziomy wsparcia i oporów
- Opcjonalne etykiety cenowe na liniach
- Kompaktowy panel kontrolny pokazujący aktualny stan rynku
- Duży centralny komunikat statusu, taki jak KUPNO, SPRZEDAŻ lub OCZEKIWANIE
- Historyczne symbole dla poprzednich zdarzeń wybicia i przebicia
W efekcie powstaje wykres, który pozostaje czytelny i efektywny, nawet podczas aktywnych warunków rynkowych.
Inteligentna logika filtrowania
SR Commander zawiera również praktyczne filtry poprawiające jakość sygnałów.
Na przykład wskaźnik może ignorować sytuacje, gdy odległość między wsparciem a oporem jest zbyt mała. Gdy obecna strefa staje się zbyt wąska, rynek może być zbyt skompresowany lub niejasny dla sensownego podejmowania decyzji. W takich przypadkach wskaźnik zwraca stan OCZEKIWANIA zamiast wymuszać sygnał niskiej jakości.
Pomaga to zmniejszyć fałszywe wyzwalacze i utrzymuje skupienie na czystszych okazjach handlowych.
Kluczowe cechy
- Automatyczne wykrywanie istotnych poziomów wsparcia i oporu
- Podkreślanie najbliższych możliwych do działania poziomów wokół bieżącej ceny
- Identyfikacja WYBICIA, PRZEBICIA i OCZEKIWANIA stanów rynku
- Opcjonalne sygnały odbicia KUPNA i odrzutu SPRZEDAŻY
- Wizualizacja historycznych wybicia i przebicia
- Regulowany bufor wybicia i tolerancja odbicia
- Opcjonalne użycie potwierdzenia zamknięcia świecy
- Czysty panel kontrolny i duży wyświetlacz statusu
- Prosty układ wizualny dla szybkiego odczytu wykresu
Dla kogo jest ten wskaźnik
SR Commander jest odpowiedni dla traderów, którzy polegają na strukturze cen i podejmowaniu decyzji opartych na poziomach, w tym:
- traderów wybicia
- traderów price action
- traderów intraday
- traderów swingowych
- traderów dyskrecjonalnych, którzy chcą czystszej struktury wykresu
- traderów szukających szybkiego wizualnego potwierdzenia wokół wsparcia i oporu
Niezależnie od tego, czy handlujesz odwróceniami, retestami, wybiciami zakresu czy kontynuacjami ruchu, SR Commander pomaga skupić się na najważniejszych poziomach na wykresie.
Dlaczego warto używać SR Commander
Rynki często stają się mylące, gdy zbyt wiele wskaźników konkuruje o uwagę. SR Commander rozwiązuje ten problem, dając traderom uporządkowany i czytelny obraz rynku poprzez jedno z najważniejszych pojęć analizy technicznej: wsparcie i opór.
Łącząc wykrywanie poziomów, logikę uwzględniającą zmienność, rozpoznawanie odbić/odrzuceń oraz status wybicia w jednym czystym narzędziu, SR Commander pomaga traderom szybko odpowiedzieć na trzy kluczowe pytania:
- Gdzie obecnie znajduje się cena?
- Czy rynek wybija się, przebija, czy nadal porusza się w zakresie?
- Czy cena reaguje siłą czy odrzutem na kluczowych poziomach?
Tworzy to bardziej zdyscyplinowany przepływ pracy i pozwala traderom podejmować decyzje z większą jasnością i mniejszym szumem na wykresie.
Ważna uwaga
SR Commander jest zaprojektowany jako narzędzie wspomagające podejmowanie decyzji w analizie technicznej. Nie gwarantuje wygranych transakcji i powinien być zawsze używany wraz z własnym kontekstem rynkowym, metodami potwierdzenia i zasadami zarządzania ryzykiem.
Podsumowanie
SR Commander identifies breakout and breakdown scenarios when price closes beyond the nearest resistance or support levels, respectively, with adjustable buffers. It also signals buy bounces and sell rejections when price tests and reacts to these levels. Historical breakout and breakdown events are marked on the chart for review and pattern recognition.
The indicator features smart filtering to avoid low-quality signals, such as ignoring zones where support and resistance are too close. Its clean visual layout includes optional price labels, a large status message, and historical reaction points, facilitating fast and structured market analysis.
SR Commander supports traders focusing on price structure and level-based strategies, including breakout, price action, intraday, and swing trading across various markets such as forex, indices, commodities, stocks, and cryptocurrencies. It serves as a decision-support tool to enhance clarity and reduce chart noise in technical analysis.


