
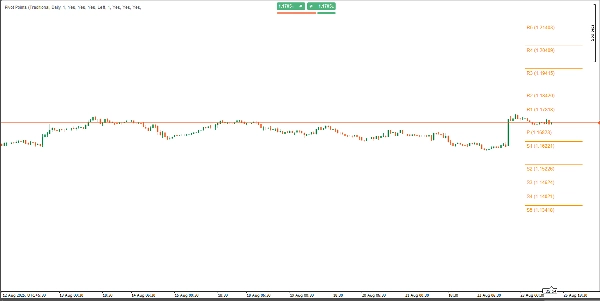
Pivot Point Daily Indicator
อินดิเคเตอร์
14 การซื้อ
เวอร์ชัน 2.0, May 2026
Windows, Mac
4.2
รีวิว: 4
คำอธิบาย
คุณสมบัติหลัก:
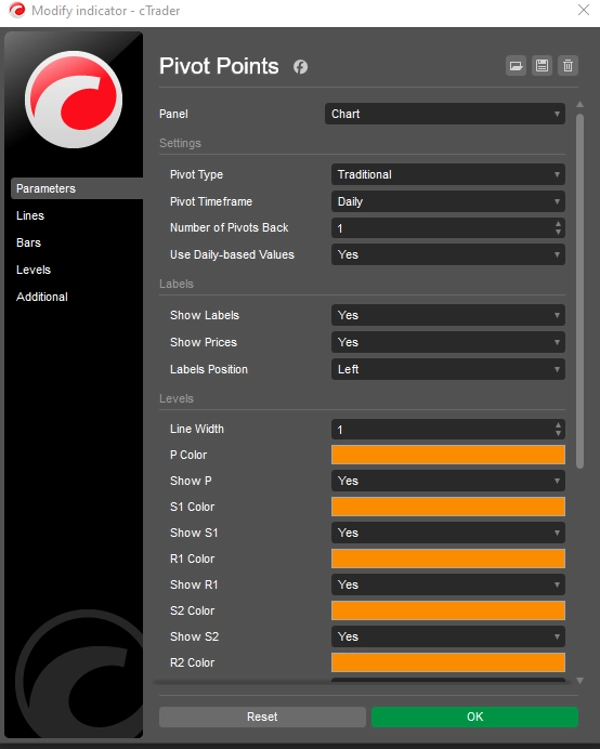
- สไตล์ Pivot หลายแบบ: สลับไปมาระหว่างวิธีการคำนวณ pivot หกแบบได้อย่างราบรื่น: Classic, Fibonacci, Woodie, Camarilla, DM และ Traditional แต่ละวิธีรองรับระดับต่าง ๆ (สูงสุดถึง R5/S5 สำหรับ Traditional และ Camarilla, R3/S3 สำหรับ Fibonacci และ P/R1/S1 สำหรับ DM)
- กรอบเวลาที่ยืดหยุ่น: เลือกจากกรอบเวลาพิวอตที่หลากหลาย รวมถึง Auto, Daily, Weekly, Monthly, Quarterly, Yearly และตัวเลือกหลายปี (Biyearly, Triyearly, Quinquennially, Decennially) เหมาะสำหรับการปรับให้สอดคล้องกับระยะเวลาการเทรดของคุณ
- การควบคุมพิวอตย้อนหลัง: ตั้งค่าจำนวนชุดพิวอตย้อนหลังที่จะแสดง (1–200) ด้วยพารามิเตอร์ Number of Pivots Back เพื่อให้กราฟไม่รกในขณะที่ยังคงรักษาระดับสำคัญในอดีตไว้
- การปรับแต่งรูปลักษณ์: ปรับสี ความกว้างเส้น และการตั้งค่าป้ายชื่อได้อย่างเต็มที่ เปิด/ปิดป้ายชื่อและค่าราคา และเลือกตำแหน่งป้ายชื่อ (ซ้ายหรือขวา) พร้อมการเลื่อนแนวตั้งอัจฉริยะเพื่อความชัดเจน
- ข้อมูลรายวันหรือภายในวัน: ตัวเลือกใช้ค่าที่อิงจากรายวันหรือข้อมูลกรอบเวลากราฟ เพื่อความยืดหยุ่นสำหรับกลยุทธ์การเทรดที่แตกต่างกัน
- ประสิทธิภาพที่ได้รับการปรับแต่ง: โค้ด cTrader ที่เบาและเนทีฟช่วยให้การอัปเดตแบบเรียลไทม์รวดเร็วไม่มีดีเลย์ รองรับ Forex, ดัชนี, สินค้าโภคภัณฑ์, คริปโต และอื่น ๆ
ทำไมต้องเลือก Pivot Points Standard?
- เครื่องมือการเทรดที่หลากหลาย: ระบุระดับแนวรับ/แนวต้านสำคัญ ทิศทางแนวโน้ม และโอกาสเบรกเอาต์ในทุกตลาดหรือกรอบเวลา
- อินเทอร์เฟซที่ใช้งานง่าย: เมนูแบบเลื่อนลงที่เข้าใจง่ายสำหรับประเภทพิวอต กรอบเวลา และตำแหน่งป้ายชื่อ ทำให้การปรับแต่งเป็นเรื่องง่าย
- การวิเคราะห์ย้อนหลัง: แสดงชุดพิวอตย้อนหลังได้สูงสุด 200 ชุด เพื่อศึกษาปฏิสัมพันธ์ราคาที่ผ่านมาและปรับกลยุทธ์ของคุณ
- การจัดกราฟที่สะอาด: การจัดตำแหน่งป้ายชื่ออย่างชาญฉลาดและความยาวเส้นที่ปรับแต่งได้ช่วยป้องกันความรกของกราฟ เพิ่มความอ่านง่าย
วิธีใช้:
- นำตัวบ่งชี้ไปใช้กับกราฟ cTrader ของคุณ
- เลือกประเภท Pivot ที่คุณชอบ (เช่น Fibonacci, Camarilla) และกรอบเวลาพิวอต (เช่น Daily, Monthly)
- ปรับ Number of Pivots Back เพื่อควบคุมชุดพิวอตย้อนหลังที่แสดง
- ปรับแต่งสี ความกว้างเส้น และการตั้งค่าป้ายชื่อให้เหมาะกับสไตล์ของคุณ
- ใช้ระดับพิวอตเพื่อระบุแนวรับ/แนวต้าน ตั้งค่า stop-loss/take-profit หรือเทรดเบรกเอาต์
เหมาะสำหรับ:
- นักเทรดรายวัน: ใช้พิวอตรายวันหรือรายสัปดาห์สำหรับการเข้าและออกภายในวัน
- นักเทรดสวิง: ใช้พิวอตรายเดือนหรือรายไตรมาสเพื่อจับแนวโน้มระยะยาว
- นักเก็งกำไรระยะสั้น: ผสมผสานกับกรอบเวลาที่ต่ำกว่าเพื่อการเทรดที่รวดเร็วและแม่นยำ
- ทุกตลาด: ทำงานได้อย่างราบรื่นใน Forex, หุ้น, คริปโต และสินค้าโภคภัณฑ์
เพิ่มความมั่นใจในการเทรดของคุณ
ด้วย Pivot Points Standard คุณจะได้รับเครื่องมือที่ทรงพลังครบวงจรที่ช่วยให้ง่ายต่อการวิเคราะห์ทางเทคนิคและเพิ่มความสามารถในการค้นหาโอกาสการเทรดที่มีความน่าจะเป็นสูง ไม่ว่าคุณจะเป็นมือใหม่หรือเทรดเดอร์ที่มีประสบการณ์ ตัวบ่งชี้นี้จะปรับให้เข้ากับกลยุทธ์ของคุณ โดยให้ระดับที่ชัดเจนและนำไปใช้ได้จริงเพื่อยกระดับการเทรดของคุณ ทดลองใช้ Pivot Points Standard วันนี้และควบคุมการเทรดของคุณด้วยความแม่นยำและความชัดเจน! ชำระเงินครั้งเดียว เข้าถึงตลอดชีพ รวมการอัปเดตในอนาคต
สรุป
สรุปโดย AI
Pivot Point Daily Indicator is a multi-timeframe pivot point tool designed for the cTrader platform. It supports six pivot calculation methods—Classic, Fibonacci, Woodie, Camarilla, DM, and Traditional—each offering various resistance and support levels (up to R5/S5 for some methods). Users can select from a broad range of timeframes including Auto, Daily, Weekly, Monthly, Quarterly, Yearly, and multi-year intervals, allowing alignment with different trading horizons.
The indicator allows displaying up to 200 historical pivot sets to analyze past price interactions while maintaining chart clarity through customizable label positions and line settings. It offers options to use daily-based or intraday data, enhancing flexibility for diverse trading strategies.
Pivot Point Daily Indicator is optimized for real-time performance with native cTrader coding, compatible across Forex, indices, commodities, cryptocurrencies, and other markets. Its interface includes intuitive dropdown menus for pivot type, timeframe, and label customization.
Traders can use this indicator to identify key support and resistance levels, trend directions, and breakout opportunities, aiding in setting stop-loss and take-profit points. It suits various trading styles including day trading, swing trading, and scalping across multiple asset classes.
โปรไฟล์อินดิเคเตอร์
หมวดหมู่อินดิเคเตอร์
แนวรับและแนวต้าน
ประเภทเอาต์พุต
ตัวกรอง
ข้อกำหนดด้านข้อมูล
แท่งเท่านั้น
สัญญาณที่รองรับ
เบรก Level ที่ระบุ
รีวิวจากลูกค้า
4.2
รีวิว: 4
5 | 25 % | |
4 | 75 % | |
3 | 0 % | |
2 | 0 % | |
1 | 0 % |
รีวิวจากลูกค้า
May 2, 2026
Bought it, added it, used it for a while, and now it's disappeared, and I cannot get it back!
August 28, 2025
Good helper for review if the trader wants it keeps attention on levels that actually matter. It works best as support, not a final decision maker. The cleanest use is 3 to 5 levels per chart, with 0.5 pullbacks checked before entry. not every zone holds, even if it looks clean.
August 27, 2025
August 27, 2025
Usable tool with purpose for traders who build plans around market levels. It gives value around key price zones, but not every zone holds, even if it looks clean. I would wait for 2 reactions and avoid trades where the target is less than 1.5R. Levels are useful when they reduce noise, not when they crowd the chart.
การสนทนา
คำถามที่พบบ่อย
Fibonacci
Prop
Forex
Breakout
Indices
Commodities
ผลิตภัณฑ์ที่มีให้บริการผ่าน cTrader Store รวมถึงบอทการเทรด อินดิเคเตอร์ และปลั๊กอิน มีให้บริการโดยนักพัฒนาบุคคลที่สามและมีไว้เพื่อวัตถุประสงค์ในการเข้าถึงข้อมูลและทางเทคนิคเท่านั้น cTrader Store ไม่ใช่โบรกเกอร์และไม่ได้ให้คำแนะนำการลงทุน คำแนะนำส่วนบุคคล หรือการรับประกันผลการดำเนินงานในอนาคต


ราคา
ตั้งแต่ 30/05/2025
40
การขาย