present
ลงทะเบียนและรับส่วนลด $50 สำหรับการซื้อครั้งแรกของคุณ
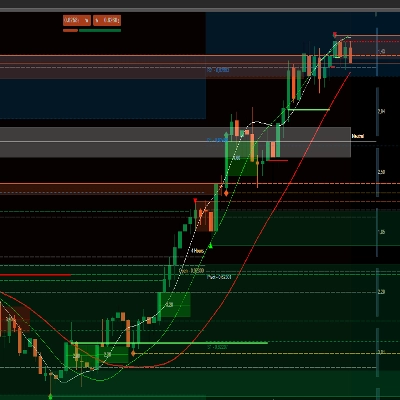
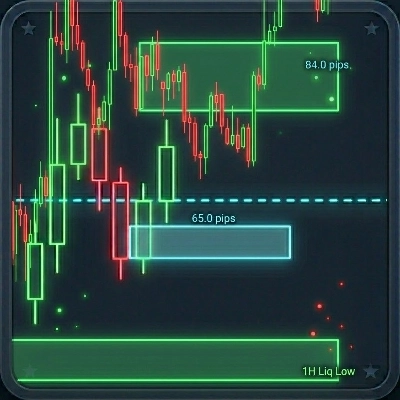
Trading product for Liquidity and IFVG อินดิเคเตอร์ Premium/Discount  Fair Value Gap, image 1
Liquidity and IFVG
อินดิเคเตอร์
1 การซื้อ
เวอร์ชัน 1.0, Jun 2026
Windows, Mac
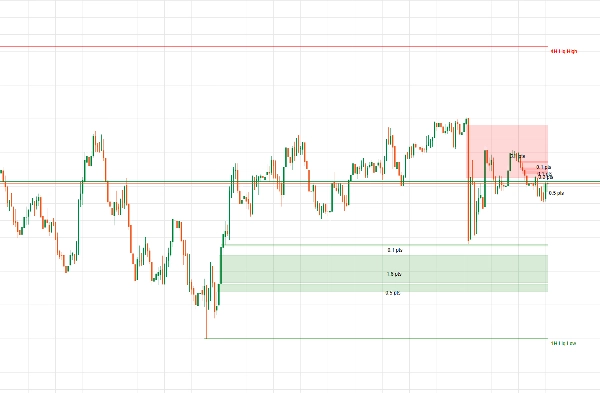
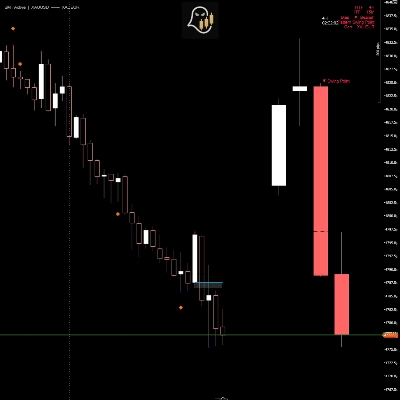
Trading product for Liquidity and IFVG อินดิเคเตอร์ Premium/Discount  Fair Value Gap, image 2
Trading product for Liquidity and IFVG อินดิเคเตอร์ Premium/Discount  Fair Value Gap, image 3
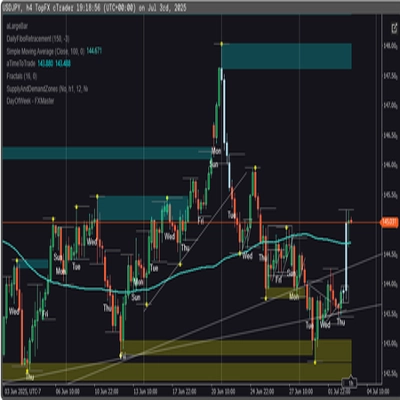
Trading product for Liquidity and IFVG อินดิเคเตอร์ Premium/Discount  Fair Value Gap, image 4
Trading product for Liquidity and IFVG อินดิเคเตอร์ Premium/Discount  Fair Value Gap, image 5
ตั้งแต่ 30/05/2025
42
การขาย

คำอธิบาย

คุณสมบัติหลัก

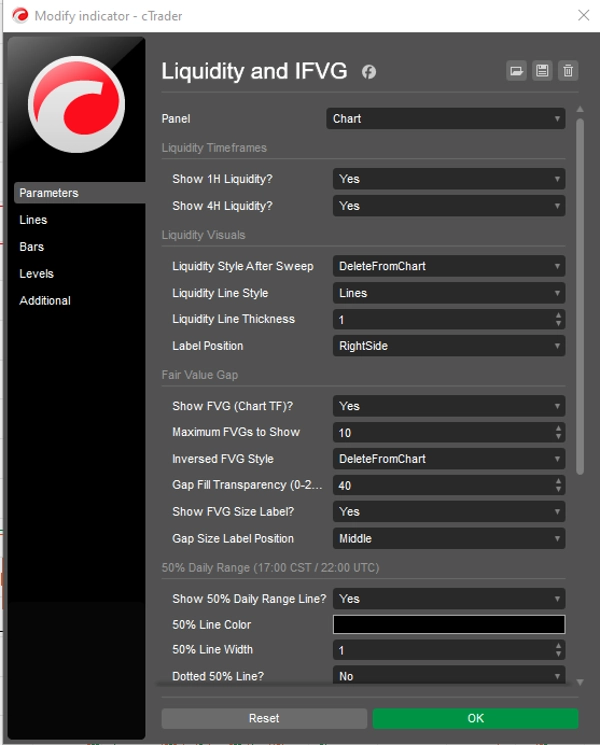
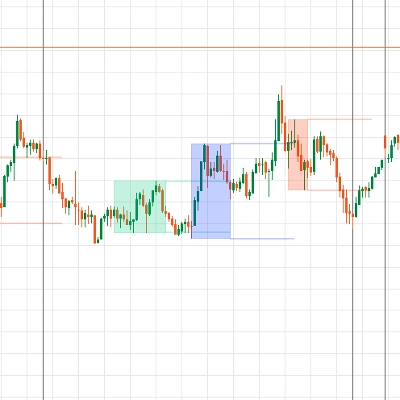
  • สภาพคล่องหลายกรอบเวลา: วาดระดับสูง/ต่ำเชิงโครงสร้าง 1H และ 4H อัตโนมัติลงบนแผนภูมิกรอบเวลาที่ต่ำกว่าของคุณ เมื่อราคากวาดระดับเหล่านี้ พวกมันจะถูกลบทันทีหรือหยุดนิ่งเพื่อทำเครื่องหมายการหยุดวิ่ง
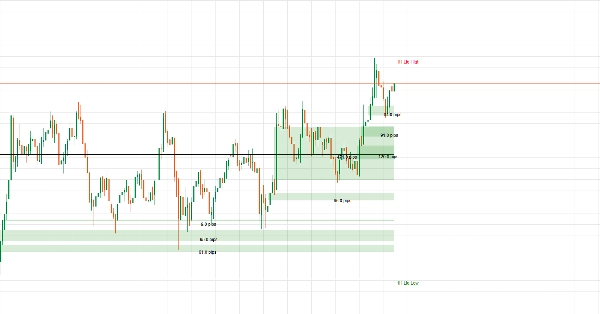
  • บล็อก FVG & การกลับตัวอัจฉริยะ: วาดช่องว่างมูลค่ายุติธรรมเป็นกล่องสีทึบแทนเส้นกลวง ช่องว่างขยายไปข้างหน้าอย่างไม่มีกำหนดจนกว่าการปิดแท่งเทียนจะทะลุผ่านอย่างสมบูรณ์ (FVG กลับด้าน)
  • เครื่องนับพิปที่แม่นยำ: แสดงขนาดที่แน่นอนของแต่ละช่องว่างลงไปถึงทศนิยมหนึ่งตำแหน่ง (เช่น 14.3 pips) เพื่อให้คุณประเมินขนาดความไม่สมดุลของตลาดได้ทันที
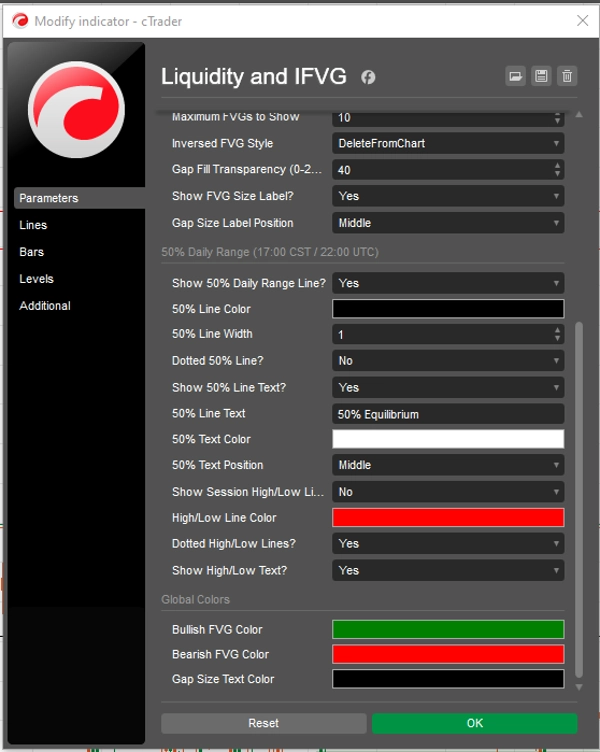
  • โซนสมดุลรายวัน 50%: วาดระดับสูง ต่ำ และจุดกึ่งกลาง 50% ที่แม่นยำของวันทำการ (รีเซ็ตที่เวลา 17:00 CST / 22:00 UTC การเปลี่ยนวันธนาคาร) เพื่อแสดงให้คุณเห็นว่าราคากำลังอยู่ในโซนพรีเมียมหรือส่วนลด
  • การควบคุมประสิทธิภาพครบถ้วน: รวมตัวเลือกสีแบบเลื่อนลงในตัว, ความทึบของกล่องพื้นหลังปรับได้, การจัดข้อความแบบ 3 ทาง และพารามิเตอร์นับจำนวนฝาครอบ FVG เพื่อให้แพลตฟอร์มของคุณทำงานได้รวดเร็ว

สรุป

AI summary
This indicator integrates Multi-Timeframe Liquidity tracking, dynamic Fair Value Gap (FVG) visualization, and a 50% Daily Range equilibrium zone to assist market structure analysis. It automatically plots 1-hour and 4-hour structural high and low levels on lower timeframe charts, highlighting liquidity sweeps that either erase or freeze to indicate stop-run events. Fair Value Gaps are displayed as solid, filled color boxes extending forward until fully broken by candle closes, with precise pip measurements provided for each gap to quantify market imbalances. The indicator also marks the active day's High, Low, and exact 50% midpoint, resetting daily at the 17:00 CST/22:00 UTC banking rollover, to identify premium and discount price zones. Users can customize visual elements including color schemes, background opacity, text alignment, and set a cap on the number of FVGs displayed to optimize performance. This tool supports visualization outputs and is designed for use with bar and tick data, aiding in reversal signal identification within market structure and smart money concepts frameworks.
โปรไฟล์อินดิเคเตอร์
หมวดหมู่อินดิเคเตอร์
โครงสร้างตลาด (SMC)
ประเภทเอาต์พุต
การแสดงเป็นภาพ
ข้อกำหนดด้านข้อมูล
แท่งเท่านั้น
ข้อมูล Tick
สัญญาณที่รองรับ
Reversal

รีวิวจากลูกค้า

0.0
รีวิว: 0
รีวิวจากลูกค้า
ยังไม่มีรีวิวสำหรับผลิตภัณฑ์นี้ หากเคยลองแล้ว ขอเชิญมาเป็นคนแรกที่บอกคนอื่น!

การสนทนา

คำถามที่พบบ่อย

Premium/Discount
Fair Value Gap
Key Levels
Liquidity Sweep
Imbalance
Liquidity Grab
ผลิตภัณฑ์ที่มีให้บริการผ่าน cTrader Store รวมถึงบอทการเทรด อินดิเคเตอร์ และปลั๊กอิน มีให้บริการโดยนักพัฒนาบุคคลที่สามและมีไว้เพื่อวัตถุประสงค์ในการเข้าถึงข้อมูลและทางเทคนิคเท่านั้น cTrader Store ไม่ใช่โบรกเกอร์และไม่ได้ให้คำแนะนำการลงทุน คำแนะนำส่วนบุคคล หรือการรับประกันผลการดำเนินงานในอนาคต
เพิ่มเติมจากผู้เขียนคนนี้

"Pivot Point Daily Indicator" โลโก้
ยอดนิยม
4.2
(4)
$20
อินดิเคเตอร์
Prop
Forex
+4
Pivot Points Standard — All-in-One Multi-Timeframe Pivot Indicator for cTrader
"support and resistance" โลโก้
ยอดนิยม
4.3
(3)
$20
อินดิเคเตอร์
Prop
Forex
+10
Support and Resistance Line Indicator with Higher Timeframe Filter
"session indicator" โลโก้
ยอดนิยม
4.3
(3)
$20
อินดิเคเตอร์
SMC
Prop
+4
📈 Trading Sessions Indicator — London, New York & Tokyo Visualize Key Market Sessions + High/Low Levels with Precision
"supertrend" โลโก้
ยอดนิยม
4.3
(3)
$20
อินดิเคเตอร์
ATR
Prop
+4
Supertrend Indicator

นอกจากนี้คุณยังอาจชอบ

อินดิเคเตอร์
Customizable window inside your platform, access to any website Calendar
อินดิเคเตอร์
ATR
Wedge
+2
Strong Supertrend Turn Market Movement into a Clear Map Market analysis
อินดิเคเตอร์
RSI
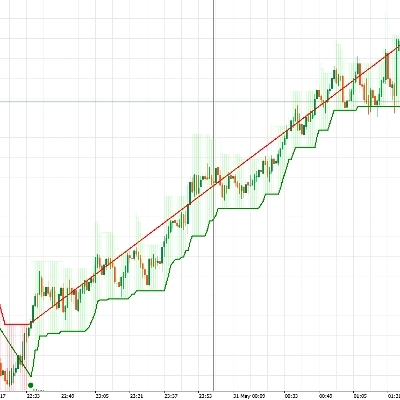
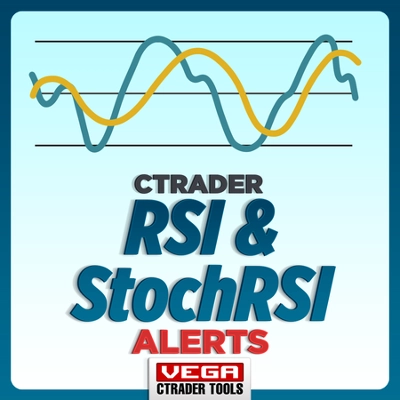
VegaXLR's cTrader StochRSI identifies overbought/oversold RSI levels for precise trade entries.
อินดิเคเตอร์
ATR
RSI
+8
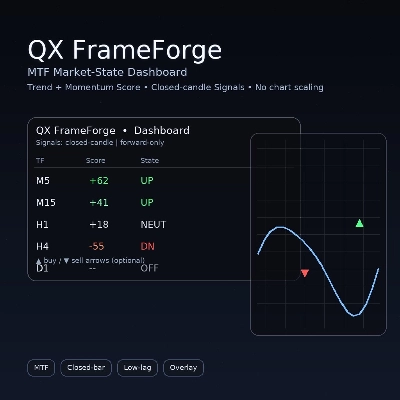
Multi-timeframe market-state dashboard: Score (-100..+100) + UP/NEUT/DN per TF, with optional closed-candle arrows.
อินดิเคเตอร์
Pin Bar
Inside Bar
+2
Advanced candlestick pattern recognition with structural quality scoring, alerts and adaptive chart visuals.
"FX Sniper" โลโก้
ยอดนิยม
4.7
(7)
$20
/
$40
อินดิเคเตอร์
AI
ATR
+10
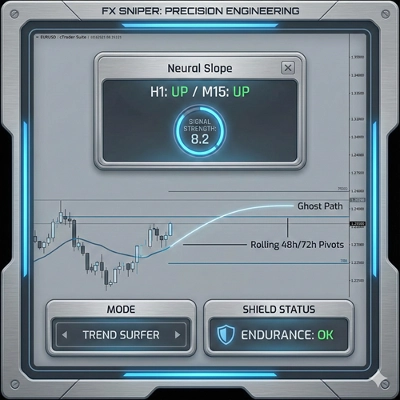
FX Sniper: Multi-pair Forex analysis tool. Features trend logic, adaptive pivots, and momentum filtering for major pairs
อินดิเคเตอร์
AI
Prop
+7
EMA Clouds, Multi-Timeframe (MTF) Overlay, Swing High/Low detection, and a smart Dashboard with neutral zone filtering.
อินดิเคเตอร์
Grid
Prop
+16
Those who are involved in trading know how important it is to take into account the previous session. With Order Block
อินดิเคเตอร์
Forex
Indices
+1
Detects HTF bias using CRT, Expansion & Swing Point patterns with SMT/PSP divergence — visualised in a floating candle
"Market Cipher A" โลโก้
ยอดนิยม
4.6
(3)
$30
/
$50
อินดิเคเตอร์
AI
ATR
+19
Market Cipher A
"[CB] Pivot Points Pro" โลโก้
ยอดนิยม
4.3
(3)
$19
/
$20
อินดิเคเตอร์
Indices
Breakout
+1
You can use the cTrader Pivot Points Pro indicator to find a good pullback entry in a trend
"Simple ICT Concepts" โลโก้
ยอดนิยม
4.6
(3)
$19
/
$34
อินดิเคเตอร์
Forex
BTCUSD
+5
Simple ICT Concepts
อินดิเคเตอร์
EMA
Volume
+4
Advanced volume‑profile tool with delta, HVN/LVN zones, and precise POC‑based trade signals.
อินดิเคเตอร์
The Multi-Timeframe Candle Indicator displays candles from multiple timeframes in one window, enhancing market analysis!
"DayOfWeek - FXMaster" โลโก้
ยอดนิยม
4.6
(3)
$19
อินดิเคเตอร์
Forex
Crypto
+3
Day of Week Indicator for cTrader
"RangePulsePro" โลโก้
ใหม่
5.0
(1)
$35
อินดิเคเตอร์
Risk Dashboard
AI-powered daily range forecasts help traders spot volatility opportunities and plan stops and targets.
"Supply&Demand" โลโก้
ยอดนิยม
4.8
(5)
$19
/
$20
อินดิเคเตอร์
RSI
MACD
+1
Precision Supply & Demand zones indicator—automatically plots key buy/sell areas on your chart for smarter entries.
อินดิเคเตอร์
Volume
Key Levels
View tick activity across a selected chart range with Point of Control, Value Area High and Value Area Low.

ราคา

ตั้งแต่ 30/05/2025
42
การขาย