
Candlestick Signal Finder
インジケーター
1 購入済
バージョン 1.0、Nov 2025
Windows、Mac
5.0
レビュー: 1
説明
cTrader用のローソク足シグナルファインダー
日本のローソク足を明確な視覚言語に変えましょう。
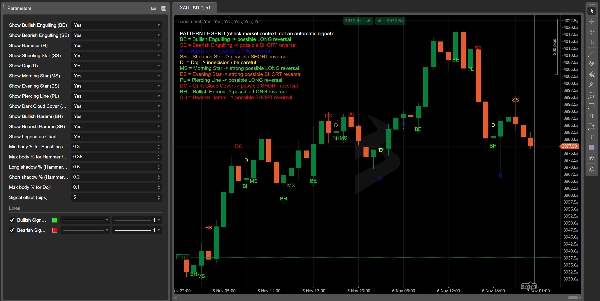
Candlestick Signal Finderは、cTrader用の高度なインジケーターで、最も人気のある日本のローソク足パターンを自動的に検出し、チャート上に明確なラベルと色で直接ハイライトします。
ローソク足を一つずつスキャンする必要はもうありません:インジケーターがパターン認識を行い、価格が潜在的な反転または迷いのシグナルを示している場所を表示します。
検出されたパターン
インジケーターは自動的に以下を識別します:
- BE – 強気の包み足 → 可能な強気の反転
- SE – 弱気の包み足 → 可能な弱気の反転
- H – ハンマー → 下落後の反発/強気の反転の可能性
- SS – シューティングスター → ラリー後の弱気の反転の可能性
- D – ドージー → 迷い、注意すべきエリア
- MS – モーニングスター → 強い強気の反転の可能性
- ES – イブニングスター → 強い弱気の反転の可能性
- PL – ピアシングライン → 可能な強気の反転
- DC – ダーククラウドカバー → 可能な弱気の反転
- BH – 強気のはらみ足 → 可能な強気の反転
- SH – 弱気のはらみ足 → 可能な弱気の反転
各パターンは 正確なローソク足に 短いコード(BE、H、SSなど)と 凡例に対応した色で マークされます。
色分けされたチャート上の凡例
チャートの左上隅には、シグナルに対応した 色分けされた凡例 が表示されます:
- 同じ コード
- 同じ 色
- 通常意味するものの簡単な説明(ロング / ショート / 注意)
これにより、インジケーターは以下に最適です:
- ローソク足パターンを 学んでいるトレーダー
- 本やウェブサイトを開かずに素早く視覚的なリマインダーが欲しい人
- チャートを使った 教育やトレードレビュー を行う教育者やコンテンツクリエイター
完全にカスタマイズ可能なパラメーター
Candlestick Signal Finderは検出の 感度 を完全にコントロールできます:
- 包み足や強いローソク足のための最小 実体の割合
- ハンマー、シューティングスター、はらみ足のための最大 実体の割合
- ハンマー / シューティングスタータイプのパターンのための長短 ヒゲ比率
- ドージー感度(実体が全範囲に対してどれだけ小さいか)
- シグナルのオフセット(ピップ単位) でラベルをローソク足の上または下に配置
- 各パターンごとの個別の オン/オフスイッチ
非常に厳しいシグナル(少ないがクリーン)や、視覚的なバックテストやトレーニングのためのより許容的な検出に調整できます。
トレーダーが好む理由
- 時間を節約: ローソク足パターンを手動で探す必要がなくなります。
- 主観性を減らす: ルールは数値的で再現可能、目視に基づいていません。
- 教育に最適: 履歴をスクロールしながらパターンのパフォーマンスを確認して目を鍛えるのに最適です。
- マルチタイムフレーム&マルチシンボル: インデックス、FX、暗号通貨、株式、商品など、cTraderでインジケーターを付けられるどこでも動作します。
⚠️ 重要: Candlestick Signal Finderは完全なトレーディングシステムではなく、完全な戦略の代わりにはなりません。パターンは常にトレンド分析、市場の文脈、適切なリスク管理と一緒に使用する必要があります。
概要
AIによる概要
Candlestick Signal Finder is a cTrader indicator designed to automatically detect and visually highlight key Japanese candlestick patterns on trading charts. It identifies popular patterns such as Bullish Engulfing, Bearish Engulfing, Hammer, Shooting Star, Doji, Morning Star, Evening Star, Piercing Line, Dark Cloud Cover, Bullish Harami, and Bearish Harami. Each detected pattern is marked directly on the relevant candle with a short code and color-coded to match a legend displayed on the chart, providing quick visual cues for potential bullish or bearish reversals and areas of indecision.
The indicator offers customizable detection sensitivity, allowing users to adjust parameters like minimum and maximum body size percentages, shadow ratios, Doji sensitivity, and label positioning. Individual patterns can be enabled or disabled to tailor the indicator to specific needs.
Candlestick Signal Finder supports multiple timeframes and symbols, including indices, forex, cryptocurrencies, stocks, and commodities. It is intended to assist traders in pattern recognition, reduce subjectivity through numeric rules, and serve as an educational tool for learning candlestick analysis. The indicator does not constitute a complete trading system and should be used alongside other analysis methods and risk management practices.
インジケーターのプロフィール
カスタマーレビュー
5.0
レビュー: 1
5 | 100 % | |
4 | 0 % | |
3 | 0 % | |
2 | 0 % | |
1 | 0 % |
カスタマーレビュー
November 18, 2025
The better read comes from the review process gets less scattered, and M15 is enough for the first pass.
ディスカッション
よくあるご質問
Signal
Indices
Commodities
Crypto
Stocks
cTrader Storeで入手可能な取引ボット、インジケーター、プラグインなどの商品は、第三者の開発者が提供するものであり、情報と技術の取得のみを目的としてご利用いただけます。cTrader Storeはブローカーではなく、投資助言や個人的な推奨を行うことも、将来のパフォーマンスを保証することもありません。


価格
42.11M
取引数量
6.13M
獲得pips
222
販売
8.39K
無料インストール