
Descrizione
MACD Pro Trader – L'indicatore di trading MACD definitivo 🚀
Stai cercando un indicatore MACD potente e professionale per migliorare la tua strategia di trading? MACD Pro Trader è lo strumento definitivo progettato per i trader che desiderano precisione, chiarezza e segnali ad alte prestazioni nelle loro decisioni di trading. Che tu sia un principiante o un trader esperto, questo avanzato indicatore MACD ti aiuterà a identificare le tendenze di mercato, individuare configurazioni di trading ad alta probabilità e massimizzare i tuoi profitti con fiducia!
🔥 Perché scegliere MACD Pro Trader?
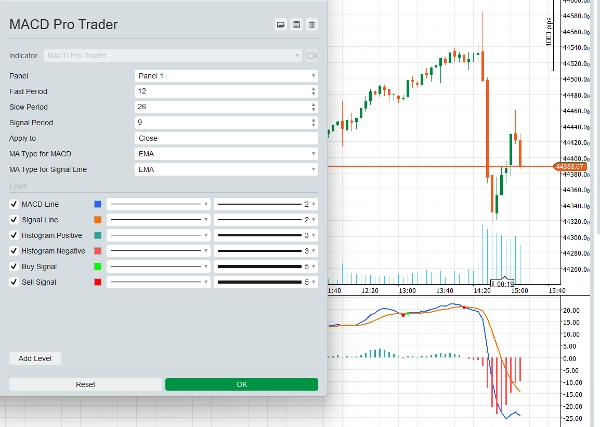
✅ Personalizzazione avanzata della media mobile – Scegli tra SMA (Media Mobile Semplice) o EMA (Media Mobile Esponenziale) sia per la linea MACD che per la linea Segnale, dandoti il pieno controllo su come l'indicatore si adatta a diverse condizioni di mercato.
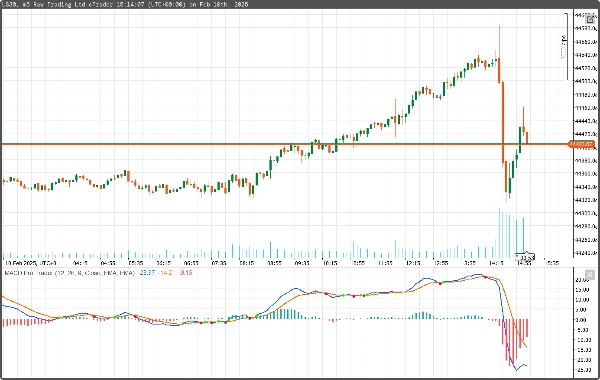
✅ Segnali intelligenti di acquisto e vendita – Ricevi segnali chiari di entrata e uscita con marcatori visivamente distinti verdi e rossi che indicano quando la linea MACD attraversa la linea Segnale. Niente più dubbi sulle entrate di trading!
✅ Istogramma a doppia tonalità per una migliore visualizzazione della tendenza – Le barre dell'istogramma positive e negative sono codificate a colori, aiutandoti a vedere immediatamente quando il momentum cambia a tuo favore.
✅ Opzioni flessibili di prezzo applicato – Applica i calcoli MACD a prezzi di Apertura, Massimo, Minimo, Chiusura, Mediano, Tipico o Ponderato per perfezionare l'indicatore al tuo stile di trading.
✅ Perfetto per Day Trading e Swing Trading – Progettato per funzionare su Forex, Azioni, Indici e Cripto, sia che tu stia facendo scalping sul grafico a 1 minuto o trading sul timeframe a 4 ore.
✅ Integrazione perfetta con cTrader – Completamente ottimizzato per cTrader con prestazioni in tempo reale e ritardi minimi, offrendoti un vantaggio rispetto ai tradizionali indicatori MACD.
📈 Come usare MACD Pro Trader per il Day Trading
Strategia: Il crossover MACD + conferma del momentum
Questa strategia semplice ma potente è progettata per catturare movimenti di prezzo a breve termine e massimizzare i profitti nei mercati in trend.
🔹 Passo 1: Identifica la tendenza
- Usa il crossover tra linea MACD e linea Segnale come primo trigger.
- Cerca il MACD che attraversa al di sopra della linea Segnale per una configurazione rialzista.
- Cerca il MACD che attraversa al di sotto della linea Segnale per una configurazione ribassista.
🔹 Passo 2: Conferma con l'istogramma
- Un istogramma positivo in crescita conferma un forte momentum rialzista.
- Un istogramma negativo in crescita conferma un forte momentum ribassista.
- Se l'istogramma è debole o piatto, aspetta un segnale più forte.
🔹 Passo 3: Entra nel trade
- Entrata long: Quando il MACD attraversa al di sopra della linea Segnale e l'istogramma diventa verde.
- Entrata short: Quando il MACD attraversa al di sotto della linea Segnale e l'istogramma diventa rosso.
🔹 Passo 4: Imposta Stop Loss e Take Profit
- Stop Loss: Posiziona lo stop loss appena sotto il minimo swing recente (per un acquisto) o sopra il massimo swing recente (per una vendita).
- Take Profit: Punta a 2 volte il tuo stop loss per un solido rapporto rischio-rendimento (es. rischiare 10 pips per guadagnare 20 pips).
🔹 Consiglio bonus: usa timeframe più alti per la conferma
Prima di entrare in un trade, controlla il timeframe superiore (es. 15m se stai facendo trading sul 5m) per confermare la direzione della tendenza. Se entrambi i timeframe sono allineati, il tuo trade ha una probabilità di successo più alta!
🎯 Per chi è MACD Pro Trader?
✅ Trader Forex alla ricerca di segnali MACD ad alta precisione.
✅ Scalper e day trader che necessitano di punti di entrata rapidi e affidabili.
✅ Trader di azioni e criptovalute che vogliono cavalcare le tendenze con fiducia.
✅ Swing trader che vogliono identificare cambiamenti di momentum a lungo termine.
Se sei stanco di perdere ottimi trade o di faticare a tempificare le tue entrate, MACD Pro Trader è la soluzione che stavi aspettando!
💎 Ottieni MACD Pro Trader oggi e porta il tuo trading al livello successivo!
🔹 100% ottimizzato per cTrader – Nessun ritardo, nessuna ridipintura, solo segnali puliti e azionabili.
🔹 Download istantaneo – Inizia a usarlo in pochi minuti!
🔹 Aggiornamenti a vita – Ricevi tutti i miglioramenti futuri senza costi aggiuntivi.
📥 Prendi la tua copia ora e inizia a fare trading in modo più intelligente! 🚀
Riepilogo
A dual-tone histogram visually represents momentum shifts with color-coded positive and negative bars, enhancing trend analysis. Users can apply MACD calculations to various price types including Open, High, Low, Close, Median, Typical, or Weighted prices to tailor the indicator to their trading style.
MACD Pro Trader is suitable for scalpers, day traders, swing traders, and those seeking to identify both short-term and long-term momentum changes. It is optimized for real-time performance with minimal lag on cTrader. The product includes a recommended trading strategy based on MACD line and Signal line crossovers confirmed by histogram momentum, with guidance on entry, stop loss, and take profit placement. Higher timeframe confirmation is suggested to improve trade probability. The indicator supports multiple timeframes from 1-minute scalping to 4-hour swing trading.
Recensioni dei clienti
5 | 50 % | |
4 | 50 % | |
3 | 0 % | |
2 | 0 % | |
1 | 0 % |


