
説明
概要
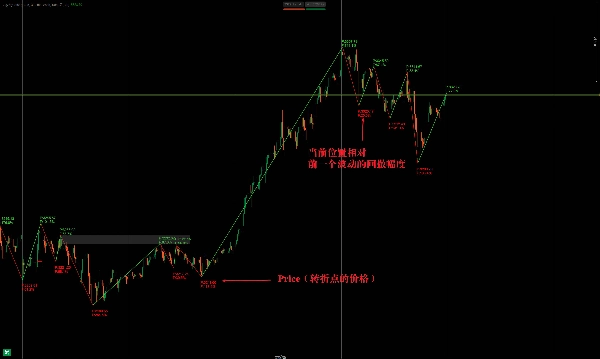
この ZigZag インジケーターは、主に市場のノイズを除去して 重要な価格の反転ポイント を特定するために使用されるテクニカル分析ツールです。重要な高値と安値をZigZagラインで結び、トレーダーがトレンドや潜在的なブレイクアウトを視覚化するのに役立ちます。
ZigZag の仕組み
- 基本機能
-
- 最小価格変動の閾値(パーセンテージまたは固定値)を設定することで小さな価格変動を除去します。
- 意味のあるスイングの高値/安値のみを接続し、トレンド分析を簡素化します。
- しばしばサポート/レジスタンスレベル、反転(例:ヘッド&ショルダー、ダブルトップ/ボトム)の検出に使用されます。
- 主要パラメーター
-
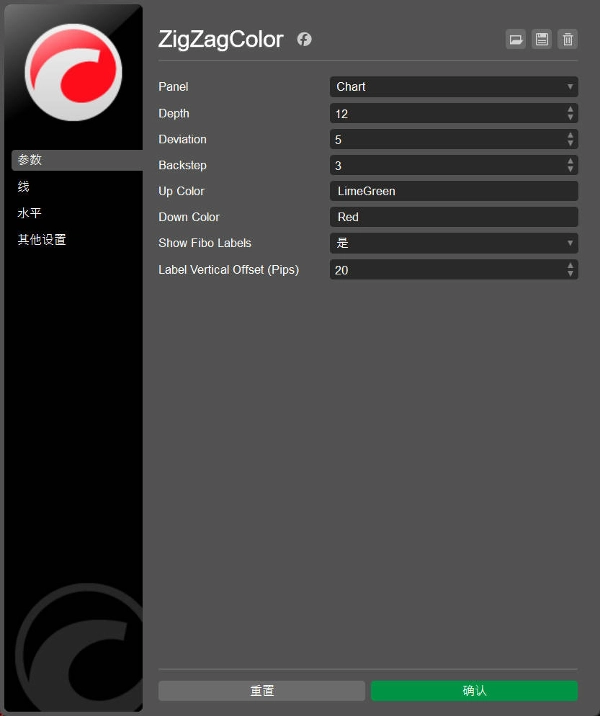
- 最小価格変動率(%):感度を決定します(例:5%はこれより小さい動きを無視)。
- 遡及深度:過去のローソク足の分析数を制御し、遅延に影響します。
主な用途
1. トレンドの識別
- 上昇トレンド: 高値切り上げ(HH)+安値切り上げ(HL)。
- 下降トレンド: 低値切り下げ(LH)+安値切り下げ(LL)。
- 潜在的なブレイクアウトトレードのためのトレンドラインの描画を支援します。
2. パターン認識
- スイングポイントを定義することで、クラシックなチャートパターン(三角形、フラッグ、ウェッジ)を明らかにします。
3. フィボナッチ・リトレースメントレベル
- 明確なスイング高値/安値をマークし、フィボナッチの拡張やリトレースメントに利用します。
4. ダイバージェンス検出
- 価格とオシレーター(RSI、MACD)間のダイバージェンスを強調表示します。
ZigZag 指標は、価格トレンドの重要な転換点を識別し、市場のノイズを除去して重要な高値と安値を強調するためのテクニカル分析ツールです。以下にその主要なポイントと使用方法を示します:
ZigZag インジケーターの原理
- 基本機能:
-
- 価格変動の閾値(パーセンテージまたは固定値)を設定し、小さな変動を自動的に無視し、顕著な高値と安値のみを接続して折れ線(ZigZag形状)を形成します。
- 支援としてサポート/レジスタンスレベルやトレンド反転(例:ヘッドアンドショルダー、ダブルボトムなど)の識別に頻繁に使用されます。
- 主要パラメーター:
-
- 最小変動幅(例:5%またはポイント数):小さな変動をフィルタリングする感度を決定します。値が大きいほど信号は少なくなりますが、より信頼性が高まります。
- 遡及深度:計算時に参照するローソク足の数を制御し、転換点の遅延に影響します。
主な用途
- トレンド識別:
-
- 連続した高値の上昇(上昇トレンド)または低値の下降(下降トレンド)によってトレンドの方向を判断します。
- トレンドラインと組み合わせて、ブレイクアウトや調整を事前に予測できます。
- パターン分析:
-
- クラシックな価格パターン(例:三角形、旗形)を識別し、ZigZagラインがパターンの境界を明確に示します。
- フィボナッチツールとの連携:
-
- ZigZagでマークされた波の高値/安値を、フィボナッチのリトレースメントやエクステンションの開始点/終了点として使用します。
- ダイバージェンス検出:
-
- 価格と指標(RSI、MACDなど)間のダイバージェンスが発生した際に、ZigZagがダイバージェンス区間の開始点と終了点を確認するのに役立ちます。
概要
インジケーターのプロフィール
カスタマーレビュー
0.0
レビュー: 0
カスタマーレビュー
この商品にはまだレビューがありません。お使いになったことがある方は、ぜひレビューをお願いします。
ディスカッション
よくあるご質問
Prop
Forex
Breakout
Indices
Commodities
RSI
Crypto
Stocks
MACD
cTrader Storeで入手可能な取引ボット、インジケーター、プラグインなどの商品は、第三者の開発者が提供するものであり、情報と技術の取得のみを目的としてご利用いただけます。cTrader Storeはブローカーではなく、投資助言や個人的な推奨を行うことも、将来のパフォーマンスを保証することもありません。


価格
登録日 30/09/2024
44
販売