
MACD Crossover PRO
Wskaźnik
3 zakupy
Wersja 1.0, Oct 2025
Windows, Mac
5.0
Opinie: 1
Opis
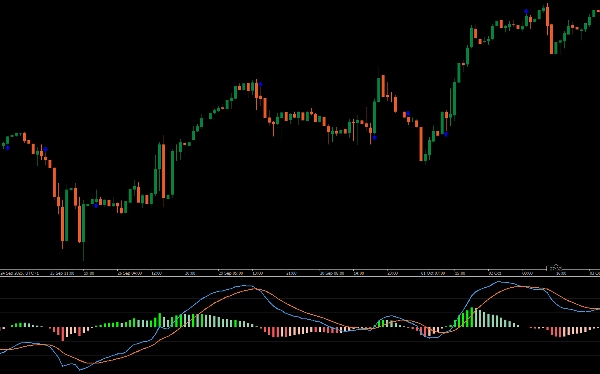
Przedstawiamy konfigurowalny klasyczny MACD wskaźnik, zaprojektowany, aby wzbogacić Twoje doświadczenia handlowe o spersonalizowane funkcje.
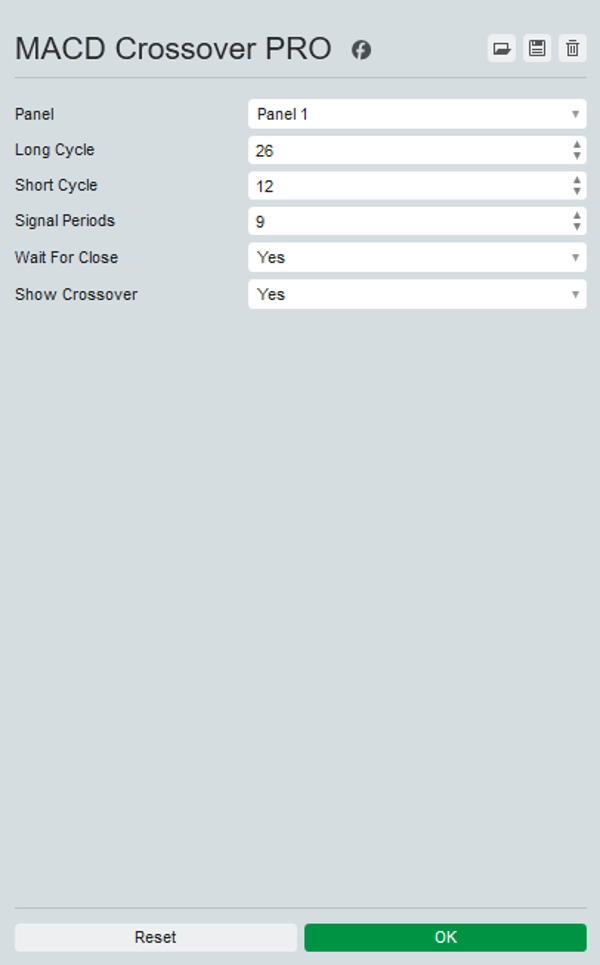
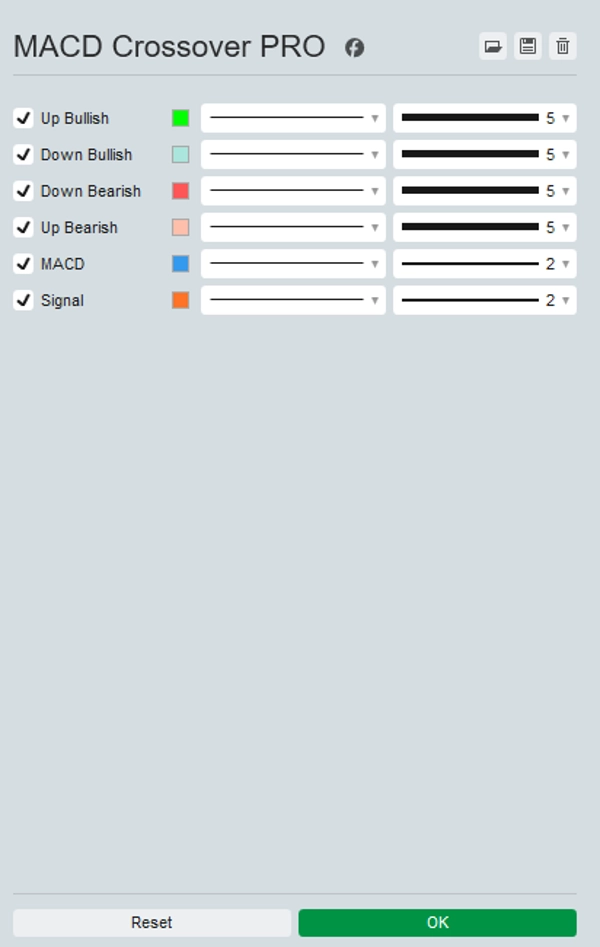
Ta ulepszona wersja tradycyjnego MACD pozwala na dostosowanie kolorów linii i histogramu dla lepszej wizualizacji wykresu. Opcjonalnie może aktualizować się w czasie rzeczywistym, korzystając z danych tick zamiast zamknięcia świecy, dostarczając terminowe informacje na szybko zmieniających się rynkach.
Dodatkowo podkreśla punkty przecięcia bezpośrednio na wykresie, ułatwiając wykrywanie potencjalnych sygnałów kupna i sprzedaży.
Ulepsz swoją strategię handlową za pomocą konfigurowalnego klasycznego MACD wskaźnika dla lepszej dokładności i podejmowania decyzji.
Podsumowanie
Podsumowanie AI
MACD Crossover PRO is a customizable version of the classic MACD (Moving Average Convergence Divergence) indicator designed for enhanced trading analysis. It allows users to personalize the colors of the MACD lines and histogram for improved chart clarity. The indicator supports real-time updates based on tick data rather than waiting for candle closes, providing more immediate insights in fast-moving markets. It also visually highlights crossover points on the chart, aiding in the identification of potential buy and sell signals. This tool is applicable across various markets including Forex, cryptocurrencies, stocks, commodities, and indices, supporting symbols such as BTCUSD, EURUSD, GBPUSD, XAUUSD, NAS100, and USDJPY. The indicator is suited for traders employing strategies like scalping and signal-based entries, aiming to improve precision and decision-making through enhanced visualization and timely data updates.
Profil wskaźnika
Opinie klientów
5.0
Opinie: 1
5 | 100 % | |
4 | 0 % | |
3 | 0 % | |
2 | 0 % | |
1 | 0 % |
Opinie klientów
October 15, 2025
The first test should keep DD under 3 percent. The review process gets less scattered.
Dyskusja
Częste pytania
BTCUSD
Forex
Signal
Indices
EURUSD
Commodities
GBPUSD
NZDUSD
Prop
Scalping
Crypto
Stocks
XAUUSD
NAS100
MACD
USDJPY
Produkty dostępne za pośrednictwem cTrader Store, w tym boty handlowe, wskaźniki i wtyczki, dostarczane są przez deweloperów zewnętrznych i udostępniane wyłącznie w celach informacyjnych oraz w celu zapewnienia dostępu technicznego. cTrader Store nie jest brokerem i nie zapewnia doradztwa inwestycyjnego, nie udziela spersonalizowanych rekomendacji ani nie gwarantuje przyszłych wyników.


Cena
Od 25/09/2025
25
Sprzedaż
315
Bezpłatne instalacje