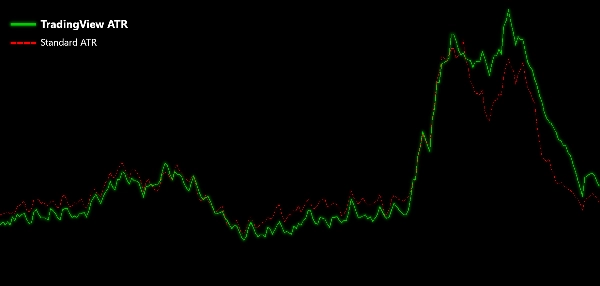
Logo "TradingView ATR"
TradingView ATR
Ảnh "TradingView ATR" được tải lên
Kể từ 25/09/2025
21
Lượt bán
180
Cài đặt miễn phí

Introducing the TradingView ATR indicator for cTrader, designed to match the precision of TradingView’s Average True Range calculation.

This enhanced ATR uses a Relative Moving Average (RMA) for its calculations, providing a more accurate reflection of market volatility compared to the default ATR in cTrader. By incorporating the RMA, this indicator offers smoother and more responsive volatility readings, helping you make better-informed trading decisions.

Perfect for traders seeking improved accuracy in their technical analysis, this ATR indicator is a powerful tool to elevate your trading strategy.

Upgrade your cTrader toolkit with this ATR indicator for precise and reliable volatility insights.

Indicator profile
0.0
Đánh giá: 0
Đánh giá của khách hàng
Sản phẩm này chưa có đánh giá nào. Bạn đã dùng thử chưa? Hãy là người đầu tiên chia sẻ với mọi người!
BTCUSD
Forex
Indices
EURUSD
Commodities
GBPUSD
NZDUSD
Prop
ATR
Crypto
Stocks
XAUUSD
NAS100
USDJPY
Products available through cTrader Store, including trading bots, indicators and plugins, are provided by third-party developers and made available for informational and technical access purposes only. cTrader Store is not a broker and does not provide investment advice, personal recommendations or any guarantee of future performance.

Sản phẩm khác của tác giả này

Professional execution engine for the Visual Risk Terminal. Instant batch orders, PnL syncing, and automated hedging.
1
Hệ số lợi nhuận
0%
Mức sụt giảm tối đa
Logo "Chandelier Exit"
$ 19
/
$20
Optimize exits with Chandelier Exit! Visualize stop-loss points dynamically for improved trading precision and safety.
Enhance trading with ATR Bands! Visualize market volatility using dynamic upper and lower ATR bands for precise decision
Enhance MACD Histogram! Visualize bull and bear price changes with vibrant colors for clearer, more insightful trading.
Unlock trading precision with QQE! Dual QQE indicators with a Bollinger Bands zero line provide clear buy/sell signals.
Customize the MACD! Choose colors, get real-time tick updates, and see crossover points for enhanced trading precision.
Logo "Consolidation Zones"
$ 19
Identify and trade breakouts with Consolidation Zones! Visualize price consolidation areas for trading opportunities.
Visual risk management terminal for cTrader. Set Lot size, SL, and TP via chart lines with real-time PnL projections.
Customize your Moving Average! Choose any timeframe and price source for precision and flexibility in your analysis.
Visualize trends with Standard Deviation Channel! Display median, and add customizable upper/lower deviation channels.
Logo "Stochastic RSI PRO"
5.0
(1)
$ 28
/
$40
Unlock Stochastic RSI PRO in cTrader! Overlay RSI, highlight zones, and identify divergences with customizable settings.
Logo "TrendShift"
$ 149
Advanced MACD & Supertrend bot. Professional trend-following logic with ATR risk management and active profit-taking.
18%
1.82
Hệ số lợi nhuận
20.05%
Mức sụt giảm tối đa

Bạn cũng có thể thích

Candle Timer & Strength DEMO for cTrader This is a DEMO version of the Candle Timer & Strength indicator. You can use al
Logo "JMA"
$ 19
Jurik Moving Average (Jurik's Moving Average) triple adaptive filter with unique Jurik smoothing and dynamic factor.
Decision System Indicator According to Cosmic Laws
Master RSI reversals with Parabolic SAR precision! Get real-time alerts for high-probability trend changes.
RSI with all acceptable MA types
Overview of the Fade Breakout Visualizer Indicator
ATR Ratio SuperTrend show Trend & volatility combined. Clean arrows, built-in Take Profit.
Smart Money Gaps: MTF FVG auto-detection, extension, and mitigation marker. Trade institutional imbalances.
Shows bullish/bearish bias for 5 timeframes in one panel. Three bias methods, alignment summary, fully configurable.
Lightweight adaptive filter with dynamic bands. Clean, noise-free trend structure.
Plots the equilibrium price levels based on previous daily highs and lows.
A real-time tick imbalance analysis tool designed specifically for Tick Imbalance Bars Plugin*
📊Zones Supply & Demand: Identifies key price levels with high volume concentration, marking Supply/Demand Zones & Marke
Volume distribution analysis with Market Profile TPO integration.
Laguerre RSI is based on John EHLERS' Laguerre Filter to avoid the noise of RSI.
✅ Unique Design. ✅ Works on All Time frames
This indicator is a powerful visualization tool 💡. Its design is flexible, robust, and solves a core problem for multi-
The Ultimate RSI is an advanced and enhanced momentum oscillator
Kể từ 25/09/2025
21
Lượt bán
180
Cài đặt miễn phí