
الوصف
كاماريلا من بوليت تريديرز — تصور الهيكل. دقة التداول.
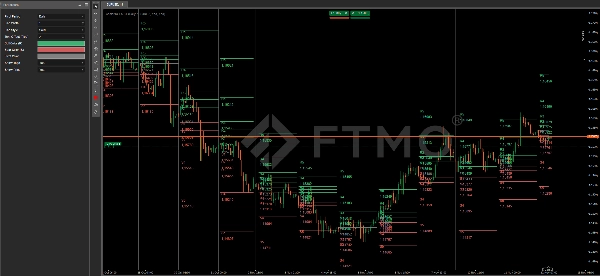
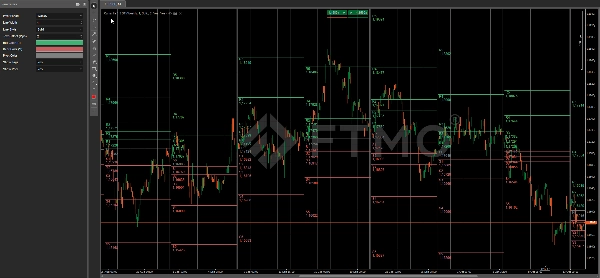
مؤشر كاماريلا احترافي المستوى لـ cTrader، مصمم لكشف كيفية تفاعل السعر حول المستويات المؤسسية.
يقوم تلقائيًا برسم جميع مستويات كاماريلا الرئيسية (R1–R5 / S1–S5) ونقاط المحور عبر أطر زمنية متعددة — مما يمنح المتداولين خريطة هيكلية واضحة للانعكاسات والاختراقات.
الميزات الرئيسية
- ✅ صيغة كاماريلا الحقيقية — تحسب المستويات من أعلى وأدنى وإغلاق الفترة السابقة.
- 📊 منطق متعدد الأطر الزمنية — اختر بين الفترات اليومية أو الأسبوعية أو الشهرية لنقاط المحور.
- 🕒 رسم الخرائط التاريخية — يرسم تلقائيًا الفترات الماضية للسياق البصري وتحليل الهيكل.
- 🎨 تخصيص النمط — ضبط عرض الخط، النمط، واللون لكل حالة (صعودية، هبوطية، محايدة).
- 💬 التسميات والأسعار — تبديل عرض النص والقيمة لتصميم نظيف أو مفصل.
- ⚡ خفيف الوزن وغير معيد للرسم — محسن للسرعة والدقة على أي رمز.
- 🧩 يعمل على جميع أنواع الرسوم البيانية — متوافق مع الوقت، النطاق، التيك، ورينكو.
مستويات كاماريلا
R5 – منطقة هدف اختراق قصوى
R4 – مقاومة رئيسية، احتمال تحفيز الاختراق
R3 – منطقة انعكاس علوية، غالبًا ما تستخدم للدخول القصير
R2 – مقاومة متوسطة المستوى
R1 – مقاومة أولية، مستوى رد فعل مبكر
PP – نقطة المحور المركزية (منطقة ارتداد المتوسط)
S1 – دعم أولي، مستوى رد فعل مبكر
S2 – دعم متوسط المستوى
S3 – منطقة انعكاس سفلية، غالبًا ما تستخدم للدخول الطويل
S4 – دعم رئيسي، احتمال تحفيز الاختراق
S5 – منطقة هدف اختراق قصوى
المعلمات
فترة المحور – اختر يومي، أسبوعي، أو شهري لحساب المستويات
عرض الخط – ضبط سمك الخط العام
نمط الخط – تعيين صلب، نقاط، أو شرطات
إزاحة النص (نقاط) – المسافة بين الخط والتسمية
لون الصعود (R) – اللون لمستويات المقاومة (R1–R5)
لون الهبوط (S) – اللون لمستويات الدعم (S1–S5)
لون المحور – اللون لخط المحور المركزي (PP)
عرض العلامات – إظهار أو إخفاء أسماء مستويات R/S
عرض السعر – إظهار أو إخفاء تسميات الأسعار الرقمية
كيفية الاستخدام
مناطق R3–S3 → مناطق انعكاس نموذجية داخل اليوم
مستويات R4–S4 → تأكيدات الاختراق أو الاستمرار
R5–S5 → أهداف عالية التقلب ومناطق الإرهاق
الملخص
Key features include automatic plotting of historical pivot levels for context, customizable line width, style, and colors for bullish, bearish, and neutral regimes, and options to show or hide level labels and price values. The indicator is lightweight, non-repainting, and compatible with various chart types such as time, range, tick, and Renko charts.
Camarilla levels serve specific roles: R3–S3 zones indicate typical intraday reversal areas; R4–S4 levels suggest breakout or continuation confirmations; and R5–S5 mark extreme breakout targets and high-volatility exhaustion zones. This tool provides a clear structural map to assist traders in identifying potential reversals, breakouts, and target zones across multiple markets including Forex, indices, commodities, cryptocurrencies, and stocks.
تقييمات العملاء
5 | 100 % | |
4 | 0 % | |
3 | 0 % | |
2 | 0 % | |
1 | 0 % |


![شعار "Trend Angle Indicator [Iridio Capital]"](https://cdn.ctrader.com/image/webp/28a98496-3412-4fea-82eb-be3347bdd6f1_27612)


