
الوصف
Woodie_CCI_pro هي مجموعة أدوات متقدمة تعتمد على CCI مبنية حول منهجية Woodie CCI الكلاسيكية.
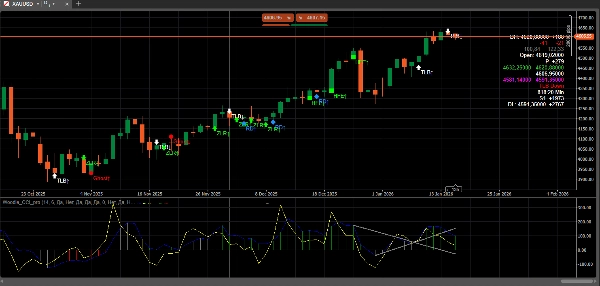
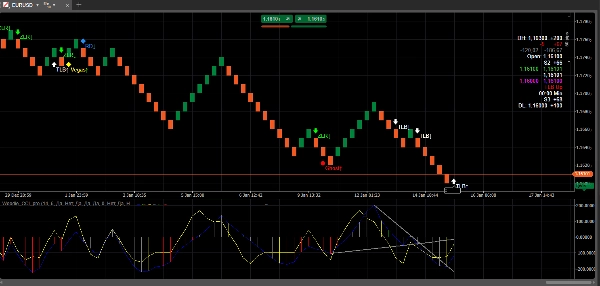
ترسم مؤشر CCI بأسلوب Woodie مع التنعيم وتبرز أهم أنماط Woodie باستخدام إشارات واضحة على الرسم البياني، وعلامات متذبذب اختيارية، وإرشادات خط الاتجاه TLB داخل لوحة CCI لسياق أفضل واتخاذ قرارات أسرع.
مصمم من أجل رؤية تاريخية واضحة: جميع الإشارات مرسومة على التاريخ، والعلامات تعرض اسم النمط الدقيق، ورسم خطوط الاتجاه محسن لتجنب تشويه المقياس و"التحف الخطية".
الميزات الأساسية
1) اكتشاف نمط Woodie (إشارات تلقائية)
يقوم Woodie_CCI_pro بالكشف عن الأنماط التالية لـ Woodie ووضع علامات عليها:
- ZLR (رفض خط الصفر)
- Ghost
- HFE (خطاف من الحد الأقصى)
- TLB (كسر خط الاتجاه)
- HTLB (كسر خط الاتجاه الأفقي)
- RD (تباعد عكسي)
- Famir
- صفقة فيغاس (VT)
كل إشارة مرسومة بعلامات توجه (صعود/هبوط) وملصق (مثلاً، ZLR↑، TLB↓) حتى تعرف دائماً بالضبط ما الذي تم تفعيله.
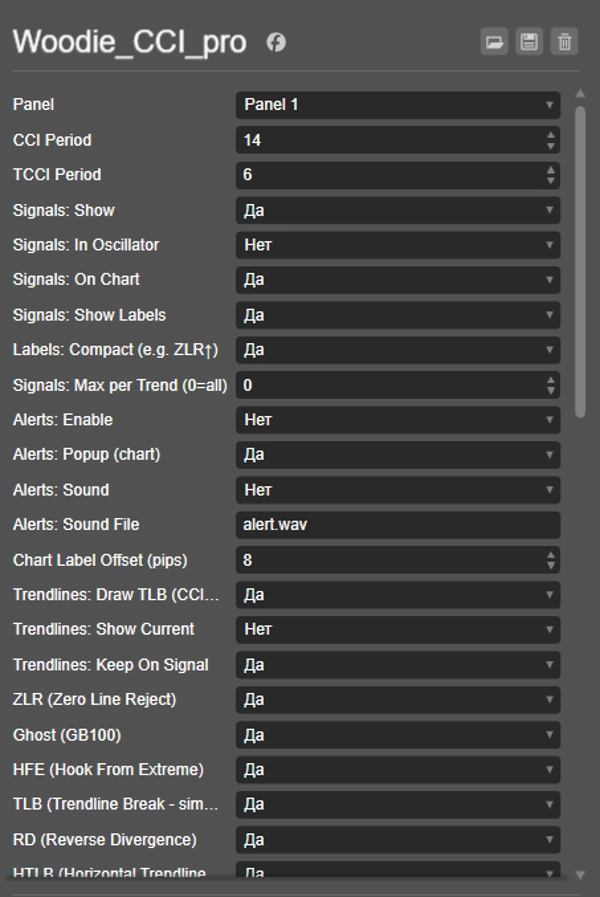
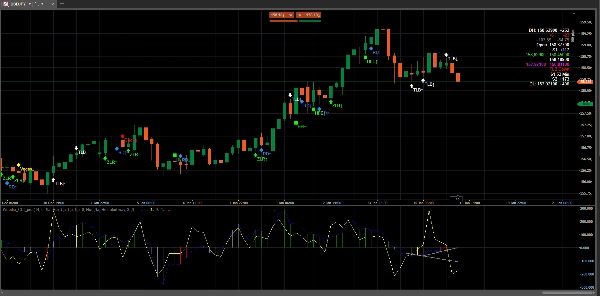
2) إشارات مباشرة على مخطط السعر
تُعرض الإشارات على مخطط السعر كسهام/أيقونات مع ملصقات نصية لأقصى وضوح أثناء مراجعة التاريخ والإعدادات الحية.
تشمل الخيارات:
- إظهار/إخفاء الإشارات على الرسم البياني
- إظهار/إخفاء الملصقات
- تنسيق ملصق مضغوط (مثال:
RD↑) - إزاحة الملصق/العلامة بوحدات النقاط لوضع نظيف
3) علامات متذبذب اختيارية
إذا كنت تفضل الإحساس الكلاسيكي لـ Woodie، يمكنك تفعيل علامات الإشارة داخل لوحة CCI (نقاط/دوائر).
هذا اختياري تماماً حتى يبقى المتذبذب نظيفاً عندما تريد فقط إشارات على مستوى المخطط.
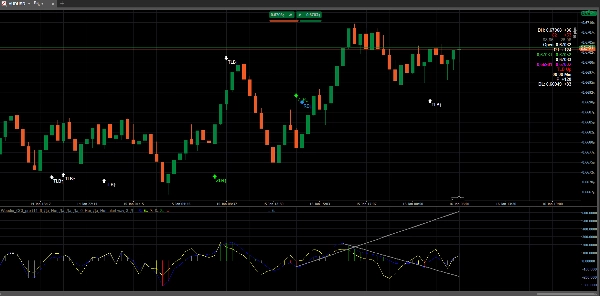
4) إرشادات خط الاتجاه TLB في لوحة CCI (بدون مشاكل في المقياس)
لتحسين التعرف على الهيكل، يمكن للمؤشر رسم خطوط اتجاه TLB داخل لوحة CCI:
- خطوط TLB الحالية (إرشادات التأرجح الأخيرة)
- خيار الاستمرار على الإشارة للحفاظ على خط الاتجاه المستخدم عند لحظة الاختراق للمراجعة لاحقاً
تم تصميم العرض ليبقى نظيفاً على التاريخ ويتجنب "التحف الحافة" أو التدرج القسري.
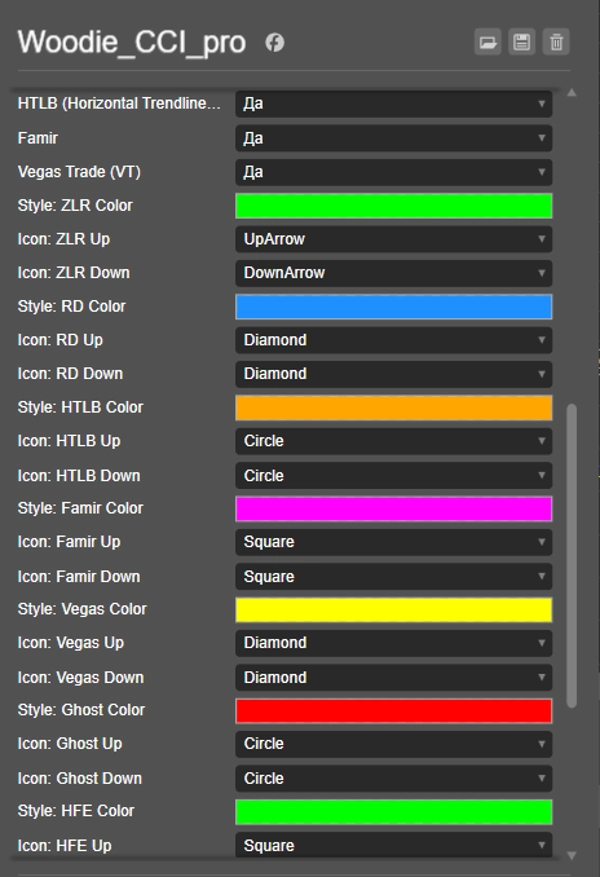
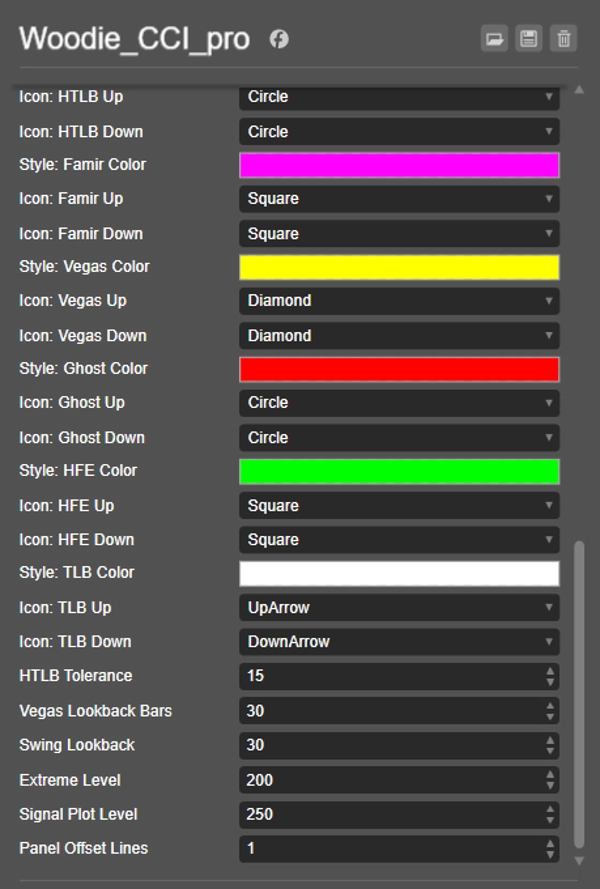
5) التحكم في النمط والتصور (لكل نمط)
يمكنك تخصيص المظهر البصري لكل نمط:
- نوع الأيقونة للصعود/الهبوط
- اللون لكل نمط (حيثما يدعم)
- الملصقات المضغوطة مقابل الكاملة
6) التنبيهات (اختياري)
تفعيل التنبيهات للإشارات المختارة:
- رسالة منبثقة على الرسم البياني
- إشعار صوتي اختياري (إذا دعمته إعدادات منصتك)
7) فلتر "الحد الأقصى للإشارات لكل اتجاه" (اختياري)
لتقليل الضوضاء، يمكنك تحديد عدد الإشارات لكل اتجاه:
الحد الأقصى لكل اتجاه (0 = غير محدود)- يحسب فقط الإشارات المتوافقة مع الاتجاه الحالي (استناداً إلى إشارة TCCI)
سير العمل النموذجي
- أضف Woodie_CCI_pro إلى مخطط.
- فعّل إشارات على المخطط و الملصقات لدراسة سلوك النمط بسرعة على التاريخ.
- شغّل خطوط اتجاه TLB إذا كنت تريد سياقاً هيكلياً للاختراقات وصفقات الاستمرار.
- اختياريًا فعّل علامات المتذبذب إذا كنت تفضل تأكيد نقاط Woodie الكلاسيكية.
ملاحظات وفلسفة
- يهدف هذا المؤشر إلى أن يكون عملياً وقابل للقراءة بدلاً من أن يكون "مفرط التخصيص".
- بعض الأنماط (خاصة القائمة على الخطوط مثل TLB/HTLB/RD/Vegas) تتضمن تسامحات/نظرات خلفية قابلة للتعديل لأن هيكل السوق يختلف بين الرموز/الأطر الزمنية.
- تم تحسين المخرجات البصرية من أجل تاريخ نظيف، وتدرج مستقر، وأقل فوضى ممكنة.
الملخص
تقييمات العملاء
5 | 50 % | |
4 | 50 % | |
3 | 0 % | |
2 | 0 % | |
1 | 0 % |


