
Atlas Seasonal Returns Heatmap
مؤشر
3 عمليات الشراء
الإصدار 1.0، Sep 2025
Windows, Mac
4.5
التقييمات: 2
الوصف
🧭 قم بتوقيت تداولاتك حسب الساعة: يكشف أطلس متى تميل الأسواق إلى التحرك حسب الشهر، يوم الأسبوع، والساعة. 🧭
شاهد متى يميل سوقك إلى التحرك — حسب الشهر، يوم الأسبوع، أو ساعة اليوم.
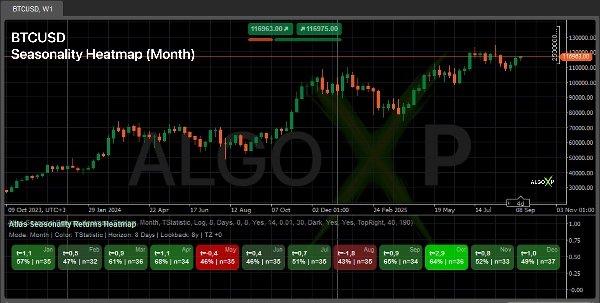
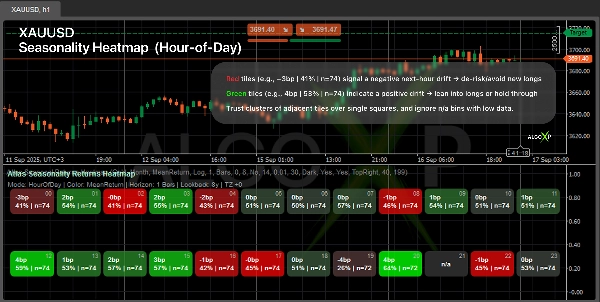
يقوم أطلس بحساب العوائد المستقبلية على أفق تختاره ويرسم خريطة حرارية متماثلة (نزول → صفر → صعود). كل مربع يعرض مقياسًا (المتوسط، إحصاء T، أو شارب) بالإضافة إلى نسبة النجاح | العدد. استخدمه لـ توقيت الدخول/الخروج، تخطيط الجلسات، و تصفية المخاطر.
🎯 لماذا يستخدمه المتداولون
- تحديد النوافذ الخضراء للاندفاع و النوافذ الحمراء للتراجع.
- تخطيط الجلسات حول الساعات/الأيام المواتية إحصائيًا.
- إضافة طبقة "متى" نظيفة للاستراتيجيات التقديرية والمنهجية.
⚙️ كيف يعمل
- ينظر إلى الأمام عبر نافذة تختارها ويلخص كيف يميل السعر إلى التصرف في تلك النافذة.
- يجمع النتائج في دلاء زمنية (شهر / يوم الأسبوع / ساعة) و يحترم منطقتك الزمنية.
- يطبق حماية من القيم الشاذة و درجة قوة متينة لكل دلو (بالإضافة إلى حجم العينة).
- يرسم خريطة حرارية متوازنة حول المحايد باستخدام ألوان صعود / صفر / هبوط الخاصة بك.
👥 لمن هو
- المتداولون التقديريون — توقيت وحجم أفضل حسب الجلسة.
- بناة الأنظمة والروبوتات — طبقة تصفية زمنية / تحديد حجم زمني للاستراتيجيات.
- متداولو العملات الرقمية والمؤشرات — أنماط سلوكية سريعة عبر الأيام/الساعات.
- المبتدئون — قراءة بسيطة: الأخضر أكثر = تحيز إيجابي أكبر على الأفق الذي تختاره.
🚀 بداية سريعة
- اختر إعداد الأصل (فوركس/كريبتو/مؤشر/ذهب).
- حدد الأفق (مثلاً، ساعة واحدة لـ HOD، يوم واحد لـ DOW/شهر).
- اضبط نافذة النظر للخلف، الحد الأدنى للملاحظات، والألوان.
- اقرأ التجمعات (عدة مربعات خضراء/حمراء متجاورة) لأقوى الإشارات.
ℹ️ الموسمية ليست ضمانًا للنتائج المستقبلية. إنها نمط إحصائي يعتمد على الفترة والمنهجية. استخدم المؤشر كـ سياق لقواعد الدخول/الخروج وإدارة المخاطر الخاصة بك، اختبر الثبات عبر نوافذ نظر للخلف متعددة، وتجنب الاعتماد على دلاء ذات حجم عينة منخفض (n).
الملخص
ملخص الذكاء الاصطناعي
Atlas Seasonal Returns Heatmap is an indicator designed to reveal when markets tend to move by analyzing forward returns over user-defined horizons. It displays a symmetric heatmap organized by time buckets—Month, Day-of-Week, and Hour-of-Day—using color-coded tiles that represent metrics such as Mean, T-stat, Sharpe ratio, along with hit percentage and sample size. This visualization helps traders identify statistically favorable periods to time entries and exits, plan trading sessions, and manage risk.
The indicator supports multiple asset presets including Forex, Crypto, Indices, and Commodities, and respects the user’s timezone. It applies outlier protection and calculates a robust strength score per time bucket to ensure reliable insights. Users can customize parameters like lookback period, minimum observations, and color schemes.
Atlas is suitable for discretionary traders seeking better timing and sizing, system and bot builders needing a time-based filter or sizing layer, crypto and index traders analyzing behavioral patterns, and beginners looking for a straightforward indication of positive or negative market bias. It provides a statistical context for entry/exit decisions and risk management but should be used alongside other analysis tools.
ملف تعريف المؤشر
تقييمات العملاء
4.5
التقييمات: 2
5 | 50 % | |
4 | 50 % | |
3 | 0 % | |
2 | 0 % | |
1 | 0 % |
تقييمات العملاء
October 1, 2025
One green trade proves nothing. It keeps weak ideas from looking too clean.
September 21, 2025
Two sessions say more than one clean chart. The checklist feels less annoying.
مناقشة
الأسئلة الشائعة
BTCUSD
Forex
Indices
EURUSD
Commodities
GBPUSD
NZDUSD
Prop
Crypto
Stocks
XAUUSD
NAS100
USDJPY
يتم توفير المنتجات المتاحة من خلال cTrader Store، بما في ذلك روبوتات التداول والمؤشرات والإضافات، من قبل مطوري الطرف الثالث وإتاحتها لأغراض الوصول المعلوماتي والفني فقط. cTrader Store ليس وسيطًا ولا يقدم نصائح استثمارية أو توصيات شخصية أو أي ضمان للأداء المستقبلي.


السعر
منذ 13/08/2025
437
المبيعات
4.57K
التثبيتات المجانية